Pixalate’s latest measurements show that between 10%-15% of programmatic desktop advertising is invalid traffic. While this rate is lower than it was when programmatic advertising rose to prominence a decade ago, fraudsters are still siphoning off a significant portion of digital ad spend. The initial efforts made by publishers and platforms need to be strengthened as fraudsters continue to find new ways to exploit desktop.
Pixalate examined invalid traffic (“IVT”) patterns for desktop display and video advertising in North America in April 2018 to provide marketers with recommendations on how to best combat the problem. You can download the full Q2 2018 Programmatic Quality Report here, but below are the key takeaways focused on desktop:
- Direct traffic had an IVT rate of 15% — tops among all traffic sources
- The ‘Entertainment’ category has a video IVT rate just under 20%
- The majority of desktop ads (about 40%) go to the ‘News & Media’ category
Although mobile has surpassed desktop in terms of ad spend, programmatic display ad spend on desktop devices is still expected to rise over 20% this year, per eMarketer, reaching $13.77 billion. However, because ad fraud remains a persistent problem, if marketers do not have comprehensive IVT detection and prevention solutions in place, then fraudsters may be the ones that benefit the most from the projected increase in ad spend.
Fraudsters are still finding new ways to steal money from marketers on desktop devices, including the operation of “zombie sites” that can hijack browsers without malware. This post breaks down IVT on desktop devices so that marketers can fully understand the industry’s biggest pain points.
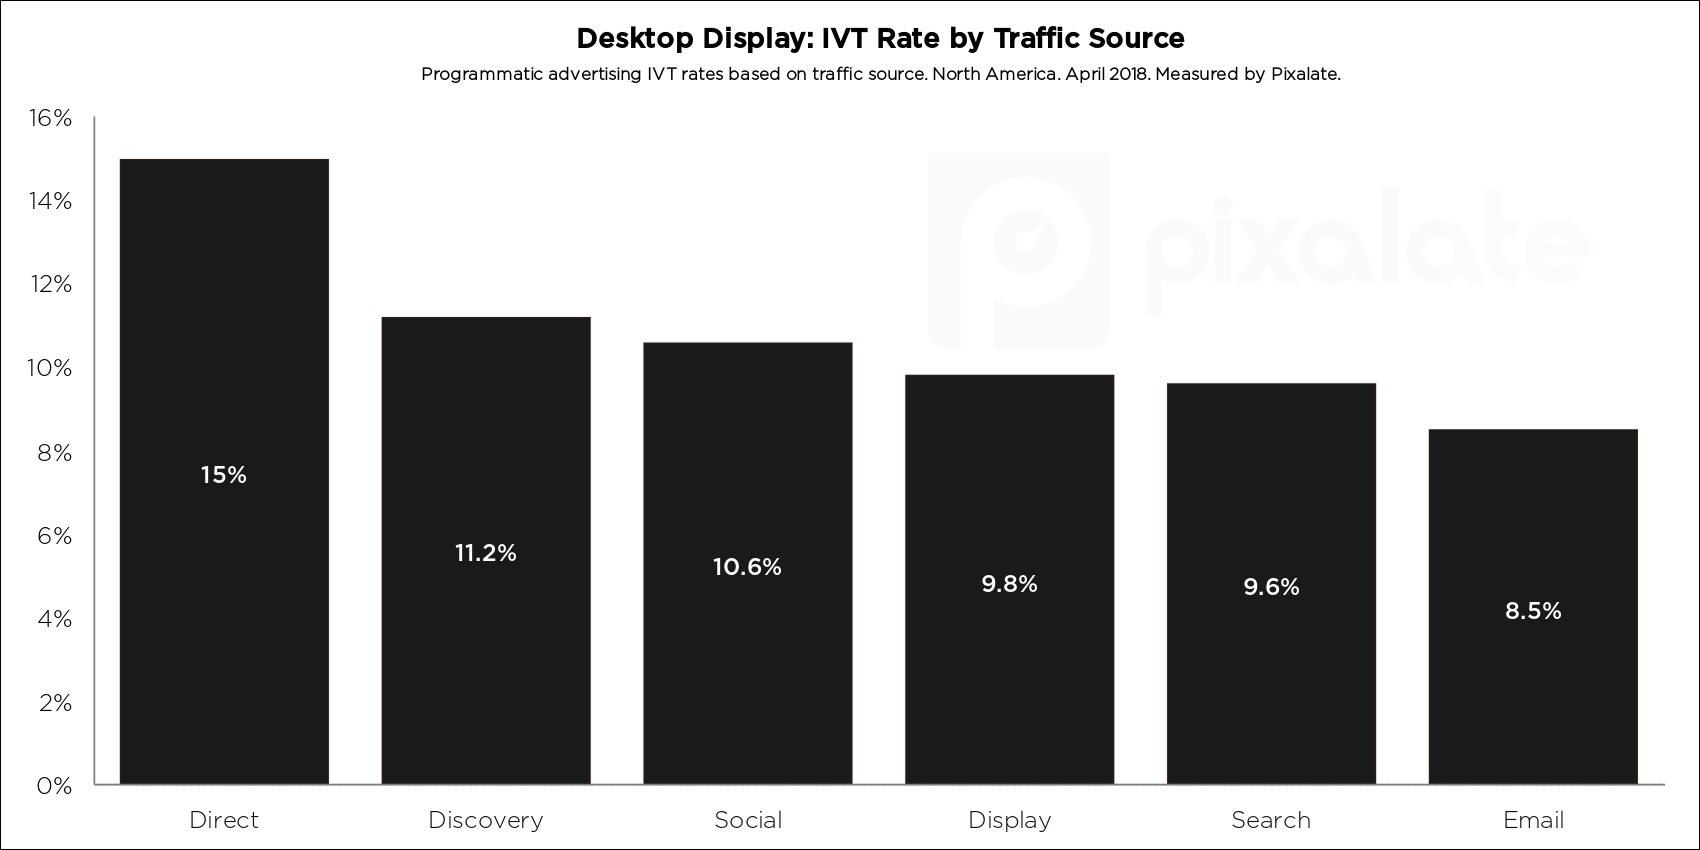
Desktop traffic coming via ‘Direct’ has an IVT rate of 15% — tops among all traffic sources
“Direct” traffic was the most susceptible to invalid activity in the time period we investigated.
Direct traffic had an IVT rate of 15%, followed by Discovery — which includes referrals from other sites — at 11.2%. Social and Search — two other major traffic-drivers — had IVT rates around 10%.
There are a variety of reasons as to why Direct might have the highest IVT rate. Fraudsters utilize tactics to hide IVT and make it appear more legitimate, such as referral scrubbing or linking from instant messaging or social apps. Additionally, if a fraudster operates their own website that perpetuates ad fraud, it is easier for them to send bot traffic directly to the domain.
Discovery traffic ranks second. Pixalate has encountered several examples of families of sites — which often appear to be owned by the same parent company — that use redirect loops to “refer” traffic from one site in the family to another. The process makes the traffic appear more legitimate (because real users do move from one site to another), but when a group of sites share a suspiciously similar “user” pool, it can be a sign that invalid activity is taking place.
Traffic coming via social was measured as invalid at a rate of 10.6%, the third-highest rate among all traffic sources. Fake social media profiles have been in the news — this summer, per the New York Times, Twitter began the process of "removing tens of millions of suspicious accounts" — and the ad industry isn’t immune. In addition to the challenges that arise from serving ads to bots within social platforms, marketers are faced with dealing with traffic that appears to come from social media but is instead invalid.
Desktop display: 'News & Media' has 11% IVT rate at 41.1% ad SOV
News & Media dominates in terms of desktop display ad share of voice, with over 41% of programmatic ads going to domains in the News & Media category. No other category had an ad SOV over 13%.
Despite recent reports that news is becoming less popular among advertisers, we still see a huge ad volume running through programmatic channels. News & Media sites will likely continue to be popular through the midterm elections.
News & Media sites had an IVT rate of 10.9% for desktop display programmatic ads in the time frame we studied, which was actually slightly below average (of all categories).
Desktop Video: ‘Entertainment' category has a nearly 20% IVT rate
In terms of programmatic desktop video advertising, News & Media again had the highest ad SOV (38%). However, Entertainment sites (26%) were not far behind.
Entertainment sites had a much larger ad SOV for video (26%) compared to display (13%). This is important for marketers to make note of because Entertainment sites also had a much higher IVT rate for desktop video (19.2%) compared to desktop display (13%). The combination of higher SOV and higher IVT should give any marketer running video campaigns on Entertainment sites pause.
Pixalate has seen a trend in which fraudsters create domains that appear to offer only content with clickbait titles focused on celebrity gossip. It appears to be a market that fraudsters are attracted to — perhaps because the content is easy to generate and likely to have a high CTR.
The Computers & Internet domain category ranks third in overall video ad SOV (12%) and it has by far the highest IVT rate, at 25.6%. This IVT rate is over twice as high as its IVT rate for display.
Recommendations for marketers
Below are a few ways in which marketers can put this data to use:
- Understand IVT rates alongside Share of Voice (SOV). Analyzing IVT rates in the context of ad SOV allows marketers to understand which categories are the most important. For example, even though Recreation had the highest IVT rate for desktop display programmatic advertising, it’s ad SOV was less than 10%. Marketers can use this data to identify which categories will offer lower IVT rates while still granting access to significant volume opportunity.
- Understand that fraudsters use different approaches for display and video. There can be large differences in IVT levels based on whether the ad is display or video — even if the ads are being served in the same domain category. The Computers & Internet category, for instance, had a 12.6% IVT rate for display, but a 25.6% IVT rate for video (over 2x higher).
- Work with a reputable vendor that can identify suspicious traffic patterns and protect you from them. Our data reveals that traffic coming via Direct sources and traffic coming via Discovery (referral) have the two highest IVT rates. Fraudsters will often use referral loops or send traffic directly to a domain — sometimes scrubbing suspect referrals along the way — in a bid to hide invalid activity. Work with a third party that is capable of identifying suspicious patterns and behaviors to protect marketers from fraudulent activity.
Methodology
Pixalate analyzed billions of programmatic advertising impressions throughout April 2018 to compile the research contained herein. Pixalate utilized its proprietary algorithms to measure invalid traffic (“IVT”) levels across desktop devices for both display and video advertising. This data represents the North American programmatic marketplace. Geography is based on the User Pool (IP) and not the region of the domain. For IVT calculations, categories of domains that had less than 1,000,000 impressions were removed. The ad Share of Voice (“SOV”) is based on all categories.
About Pixalate
Pixalate is a cross-channel fraud intelligence company that works with brands and platforms to prevent invalid traffic and improve ad inventory quality.
%20BUNDLE%20IDs%20MAY%202026.jpg)

%20Mobile%20Apps%20Benchmarks%20Report%20-%20Q1%202026%20-%20Global.png)