The Q1 2023 IVT Benchmark Report provided a comprehensive examination of the global state of IVT and ad fraud in Q1 2023 across the top two CTV (Roku, Amazon Fire TV) and mobile (Apple, Google) app stores.

We thought it would be beneficial to highlight some of the most interesting findings.
1. IVT by CTV Device type
IVT rate of 53% on Google Chromecast devices in Q1 2023
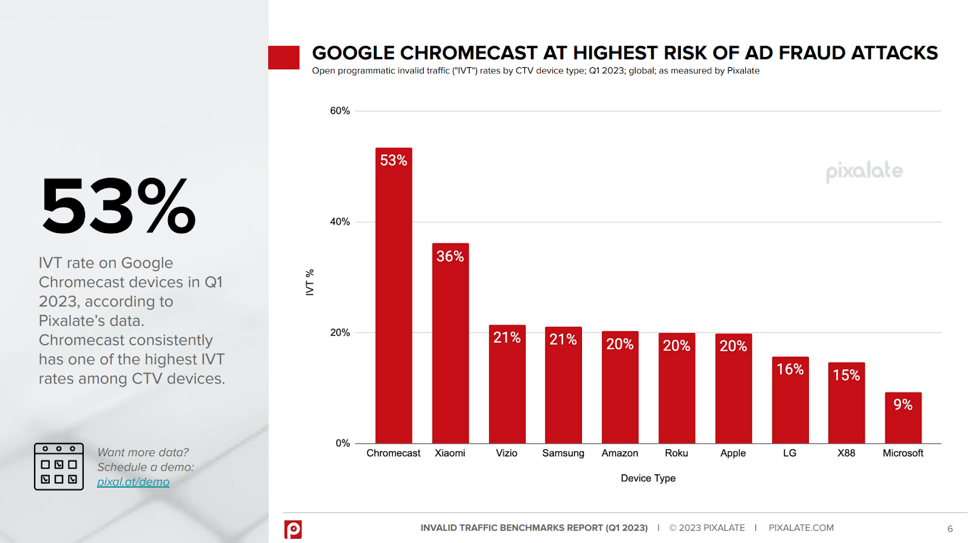
Open programmatic invalid traffic ("IVT") rates by CTV device type; Q1 2023; global; as measured by Pixalate:
- Chromecast - 53%
- Xiaomi - 36%
- Vizio - 21%
- Samsung - 21%
- Amazon - 20%
- Roku - 20%
- Apple - 20%
- LG - 16%
- X88 - 15%
- Microsoft - 9%
2. IVT by country
IVT rate of 19% for open programmatic CTV ads served in the U.S. in Q1 2023
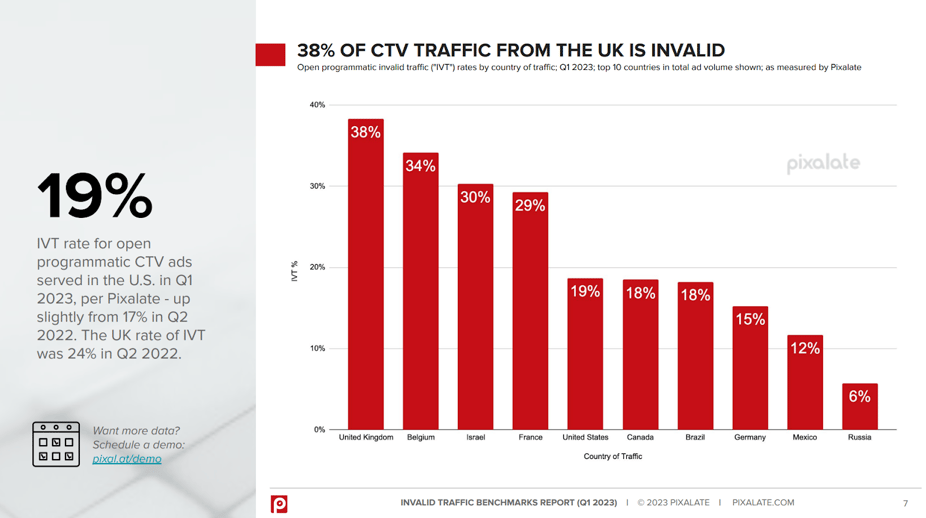
Open programmatic invalid traffic ("IVT") rates by country of traffic; Q1 2023; top 10 countries in total ad volume shown; as measured by Pixalate:
- United Kingdom - 38%
- Belgium - 34%
- Israel - 30%
- France - 29%
- United States - 19%
- Canada - 18%
- Brazil - 18%
- Germany - 15%
- Mexico - 12%
- Russia - 6%
IVT rate of 23% in the open programmatic mobile in-app ad marketplace (Google and Apple combined) in Q1 2023 for traffic in the U.S.
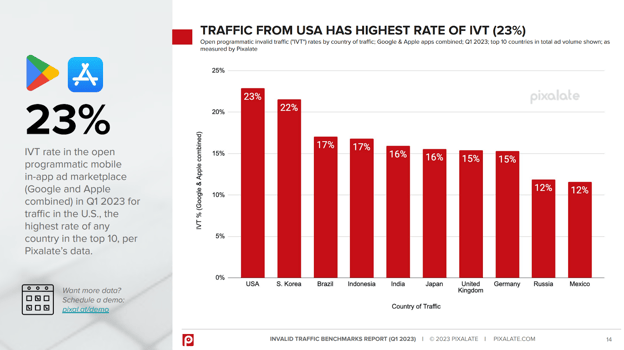
Open programmatic invalid traffic ("IVT") rates by country of traffic; Google & Apple apps combined; Q1 2023; top 10 countries in total ad volume shown; as measured by Pixalate:
- USA - 23%
- Korea - 22%
- Brazil - 17%
- Indonesia - 17%
- India - 16%
- Japan - 16%
- United Kingdom - 15%
- Germany - 15%
- Russia - 12%
- Mexico - 12%
3. IVT and app-ads.txt
2.3x higher invalid traffic (IVT) rate in open programmatic mobile ads on Apple apps without app-ads.txt vs. those with app-ads.txt, Q1 2023
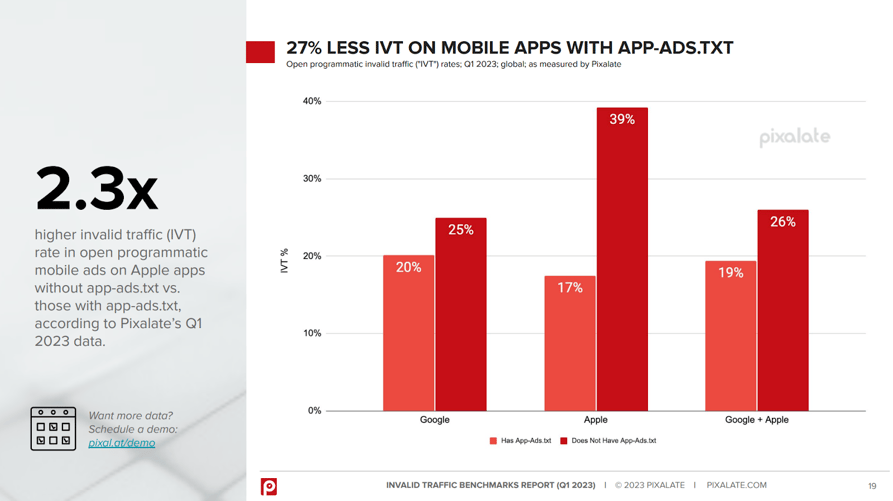
Open programmatic invalid traffic ("IVT") rates; Q1 2023; global; as measured by Pixalate:
Google
- Has App-Ads.txt - 20%
- Does Not Have App-Ads.txt - 25%
Apple
- Has App-Ads.txt - 17%
- Does Not Have App-Ads.txt - 39%
Google and Apple
- Has App-Ads.txt - 19%
- Does Not Have App-Ads.txt - 26%
For more Q1 2023 IVT Benchmarks analysis, download a free copy of the report here:
The research contained in this report represents monthly data collected by Pixalate from January 1, 2023 through March 31, 2023.
If you are interested in more insights like the above, across desktop, mobile and CTV devices, please reach out to us using this contact form.
Disclaimer
The content of this blog, and the Q1 2023 Invalid Traffic Benchmarks Report (the "Report"), reflect Pixalate's opinions with respect to factors that Pixalate believes can be useful to the digital media industry. Any data shared is grounded in Pixalate's proprietary technology and analytics, which Pixalate is continuously evaluating and updating. Any references to outside sources should not be construed as endorsements. Pixalate's opinions are just that, opinions, which means that they are neither facts nor guarantees. Pixalate is sharing this data not to impugn the standing or reputation of any entity, person or app, but, instead, to report findings and trends pertaining to programmatic advertising activity across CTV and mobile apps in the time period studied.