What are the latest mobile ad fraud trends and invalid traffic (IVT) rates in programmatic advertising? Pixalate reviews its most recent ad fraud report to give you the most recent mobile ad fraud trends in digital advertising.
Download our most recent report for a comprehensive rundown of the latest Mobile Ad Fraud Trends.

Mobile ad fraud trends: App advertising (Q4 2018)
Mobile ad fraud can cost advertisers millions of dollars, and our latest mobile ad fraud trends show that mobile in-app IVT rates rose 33% in Q4 2018.
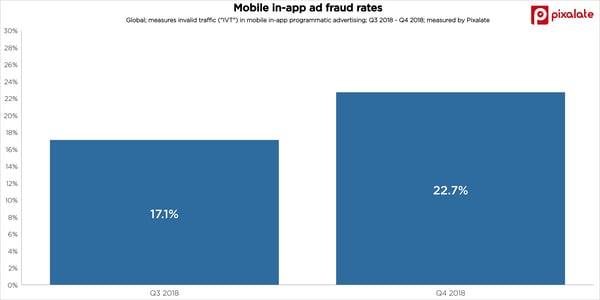
- Invalid traffic (IVT) was 22.7% in Q4 2018
- This is a rise of 33% quarter-over-quarter
Mobile ad fraud trends: Android vs. iOS (Q4 2018)
Android devices had a 1.7x highest mobile ad fraud rate compared to iOS devices. Our mobile app fraud trends details the riskiest app categories on both Android and iOS.
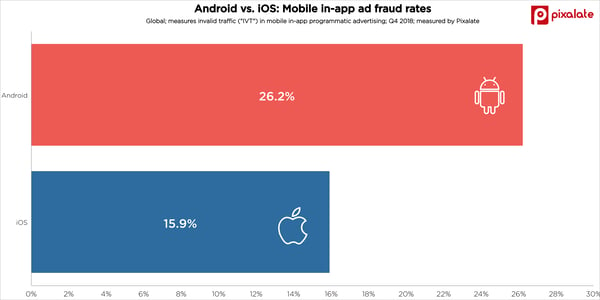
- Android devices had a 26.2% mobile ad fraud rate in Q4 2018
- iOS devices had a 15.9% mobile ad fraud rate
- Overall, Android devices had a 1.7x higher IVT rate vs. iOS devices
Mobile ad fraud trends: Android vs. iOS display advertising (Q4 2018)
Over one-in-four (25.2%) display ads on Android devices are invalid.
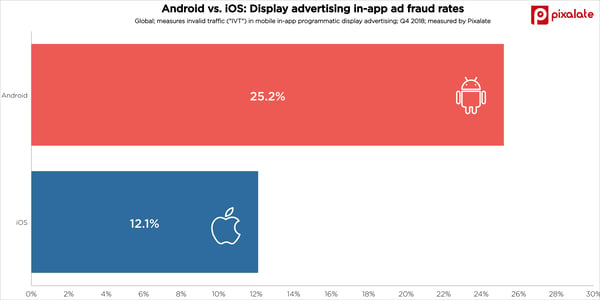
- Android in-app display advertising was over 25% IVT in Q4 2018
- iOS in-app display advertising was 12.1% IVT — 70% lower than Android
Mobile ad fraud trends: Android vs. iOS video advertising (Q4 2018)
Is mobile video advertising iOS' weak spot? iOS devices had higher in-app video ad fraud rates compared to Android.
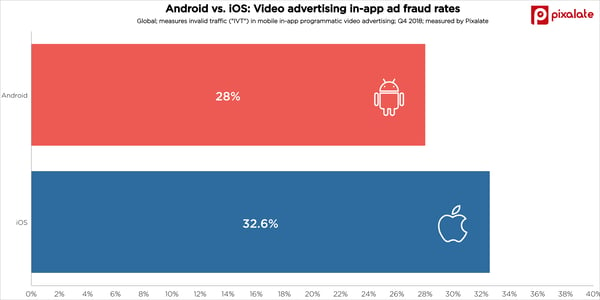
- iOS devices had video IVT rates of 33% in Q4 2018, compared to 28% for Android
- This is a difference of 15%
- iOS devices had higher video IVT rates than Android in Q3 as well
Download our most recent report for the latest Mobile Ad Fraud Trends:
Still looking or more information about ad fraud?
For a high-level view of IVT in digital advertising, view our overall ad fraud trends.
For a more granular view of IVT in mobile advertising, view our mobile app fraud trends.