Pixalate recently conducted research into programmatic ad fraud rates during the first quarter of 2017 across the desktop, mobile, and video advertising spaces. Trust and transparency are the most pressing issues in the programmatic ecosystem today, and ad fraud is at the center of the discussion. Our research and insights can be used as valuable resources and benchmarks as the ad world combats fraudulent activity.
Pixalate used the following methodology:
- Data was aggregated based on unfiltered sold impressions in programmatic.
- Devices were detected based on user agent provided in the bid stream that were then categorized by using wurfl device detection system.
Programmatic desktop ad fraud rates by country
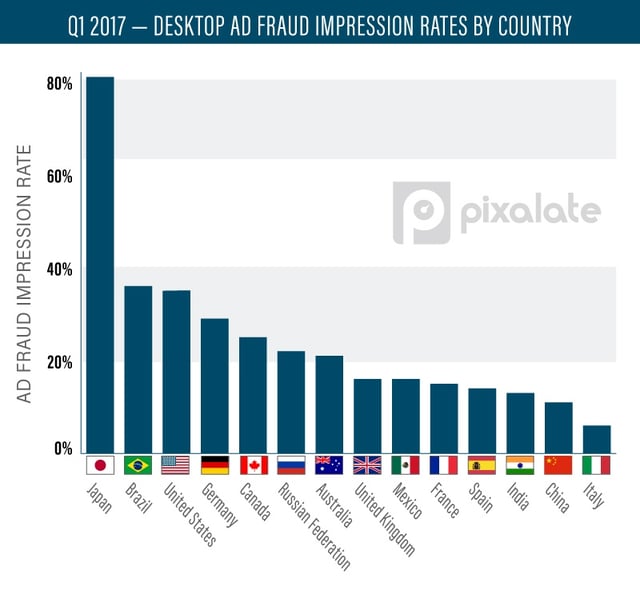
Countries with exceptionally high fraud rates contain data-centers from big cloud providers.
Over one-third (35%) of programmatically-traded desktop ad impressions in the United States were fraudulent in Q1 2017.
Brazil (36%) and Japan (81%) were two of the most notable countries that had higher fraud rates than the U.S. in Q1, but the U.S. had a high fraud rate when compared to the entire globe. Of the roughly 200 countries and other areas studied, the U.S. had the 14th-highest desktop impression fraud rate in Q1.
According to eMarketer, in 2016, U.S. marketers spent $25.23 billion on digital display via programmatic channels, representing nearly three-fourths (73%) of their total digital display ad budgets. These large investments coupled with the high ad fraud rates have led many marketers to call for more transparency and quality in the programmatic marketplace.
Notably, earlier in 2017, P&G’s Chief Brand Officer, Marc Pritchard, said that P&G doesn’t "want to waste time and money on a crappy media supply chain” while urging others in the industry to follow suit, per Advertising Age.
The fraud rates in the U.S. are particularly noteworthy when compared to some of the other leading countries in the programmatic space. For example, the United Kingdom, the No. 3 country in terms of programmatic impression volume, had a fraudulent desktop impression rate of 16% in Q1 — less than half of what the U.S. experienced.
The U.S. market is not alone, however. Brazil — another country that’s high on programmatic — had a fraud rate similar to the U.S., at 36%. Japan, meanwhile, is one of the world’s largest homes, outside the U.S., to high-volume data-centers, which account for Japan's high overall ad fraud rate.
Programmatic mobile ad fraud rates by country
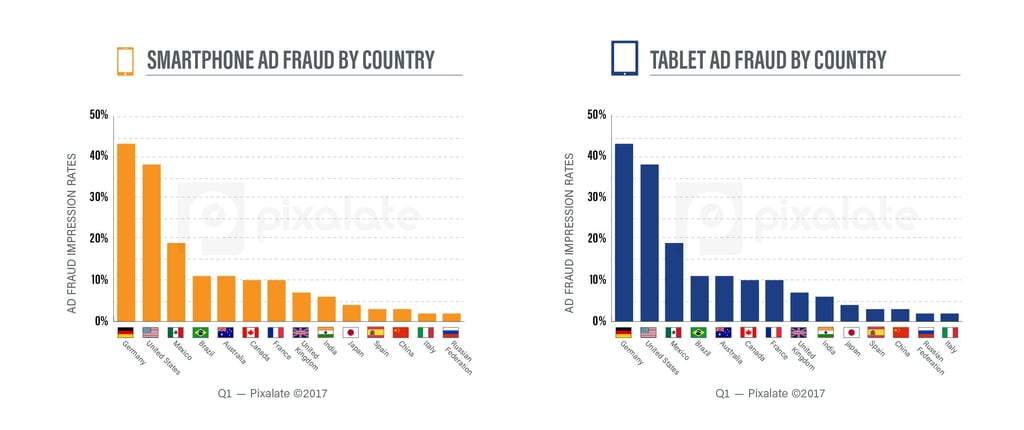
In the programmatic ad-buying world, mobile has become king. But just like in the desktop space, ad fraud is a pervasive problem on mobile devices — both tablets and smartphones. Interestingly, however, tablets and smartphones typically experience drastically different ad fraud rates.
In Q1 2017, the U.S. had the fourth-highest smartphone ad fraud rate of any country in the entire world, at 38%. Greece (48%), Germany (43%), and Malaysia (40%) were the only countries who saw higher mobile ad fraud rates in the programmatic space than the U.S.
The U.S. saw tablet ad fraud at a rate of 17% in Q1, ranking 38th out of the nearly 200 countries and other areas studied. In the other key markets shown in the chart above, only Germany (18%) and India (22%) had a higher tablet fraud rates than the U.S.
The United Kingdom had smartphone and tablet fraud rates of 7%, well below the U.S. figures. Brazil also had equal smartphone and tablet fraud rates (11%) well below U.S. figures.
Interestingly, Japan, Spain, Italy, and Russia all had higher tablet ad fraud rates, compared to smartphone ad fraud rates. In most countries studied, the ad fraud rates were higher on smartphones.
Marketers can use this data to inform their mobile programmatic strategies. U.S. marketers who are investing heavily in mobile — particularly on smartphones — should be working with a fraud prevention company to ensure that over one-third of their mobile budgets don’t go to waste.
Conversely, marketers can consider whether they can achieve the same mobile campaign KPIs if they shift more spend to tablets versus smartphones. Our research shows that, in the U.S. and many other countries, ad fraud rates are significantly lower on tablets than on smartphones.
Recent eMarketer estimates note that in 2017, roughly 80% of programmatic ad spend will be dedicated to mobile devices — representing over $24 billion in spend. With upwards of 38% of mobile inventory proving fraudulent, marketers are set to lose billions in 2017 due to ad fraud in the mobile space alone.
And if ad fraud is not reduced, then the money lost will only continue to rise. eMarketer estimates that mobile programmatic ad spend will reach over $36 billion by 2019.
Programmatic video ad fraud rates by country
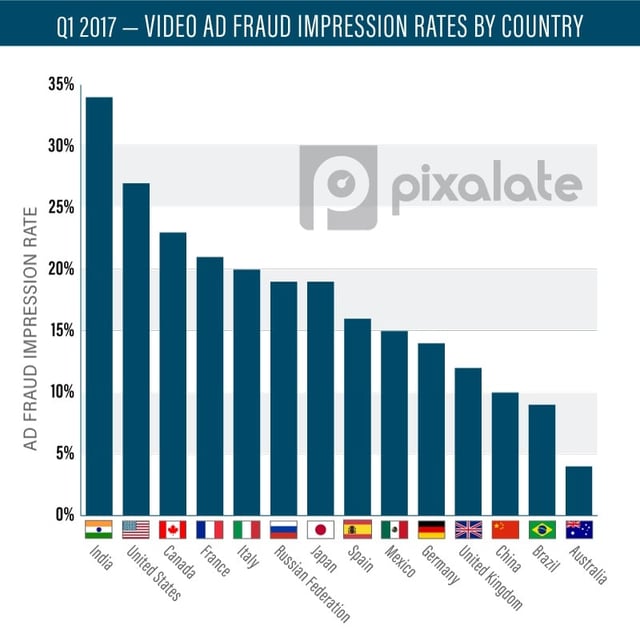
Our research also uncovered revealing figures about programmatic video ad fraud rates during Q1 2017.
In the U.S., over one-in-four (27%) of programmatic video impressions were fraudulent during Q1 2017. Of the countries listed above, only India (34%) had a higher video ad fraud impression rate than the U.S.
Canada (23%), France (21%), Italy (20%), Russia (19%), and Japan (19%) all had similar video ad impression fraud rates, at roughly one-in-five.
The United Kingdom’s programmatic video ad fraud rate was 12%. This is similar to the trends discovered for desktop and mobile programmatic ad fraud, in which the U.K.'s ad fraud rates were roughly half of the U.S.'s.
Only Brazil (9%) and Australia (4%) had programmatic video ad fraud rates below 10%. Australia’s low 4% video ad fraud rate sticks out, especially when considering Australia had above-average ad fraud rates for desktop and mobile programmatic impressions.
All advertisers — whether they are buying desktop, mobile, or video inventory via programmatic — need to be keenly aware of, and account for, the impact geography can have on the potential for ad fraud to disrupt performance.
This is the first post in a series of articles highlighting Pixalate's Quarterly Global Ad Fraud Benchmarks. We will continue to release new data and insights throughout the week.