<img height="1" width="1" style="display:none" src="https://www.facebook.com/tr?id=134132097137679&amp;ev=PageView&amp;noscript=1">

Publisher Trust Index: Methodology


Authors: Amin Bandeali, CTO; Angelos Lazaris, Chief Data Scientist; Melwin Poovakottu, Data Scientist

Introduction

Pixalate pioneered quality ratings for digital advertising with the Seller Trust Index. We are now bringing that same concept to mobile and Connected TV (CTV) apps with the Global Publisher Trust Indexes.

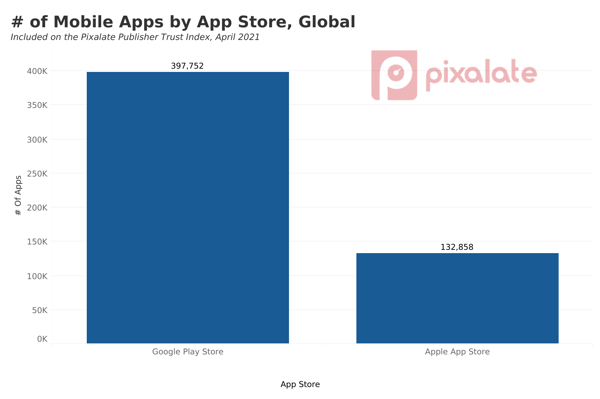
The new CTV & Mobile App quality ratings for the programmatic supply chain are based on Pixalate’s benchmark analysis of over 5 million apps across the Google, Apple, Roku, and Amazon app stores.

google-play-square-2
Clean & Elegant
Fully Responsive
ios-square
Clean & Elegant
Fully Responsive
roki-square
Clean & Elegant
Fully Responsive
fire-tv-square
Clean & Elegant
Fully Responsive

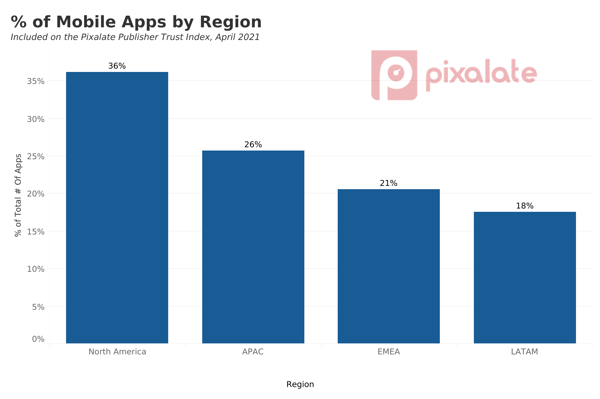
Pixalate's new Publisher Trust Indexes supply quality-based app rankings by region (North America, APAC, EMEA, LATAM, and global) and by app category.

This page details our methodology and FAQs for the Publisher Trust Indexes.

Table of Contents

  1. High-Level Stats
  2. The Data Science Team
  3. The Publisher Trust Indexes
    1. Mobile Publisher Trust Index
      1. About
      2. Google Play Store Apps, Metrics Analyzed
      3. Apple App Store Apps, Metrics Analyzed
    2. CTV Publisher Trust Index
      1. About
      2. Roku Channel Store Apps, Metrics Analyzed
      3. Amazon Fire TV App Store Apps, Metrics Analyzed
    3. Grades and Ratings Curve
  4. Methodology
    1. Metrics and Ratings
      1. Data collection and preprocessing 
      2. Metric: Ad Density
      3. Metric: Ads.txt
      4. Metric: Brand Safety
      5. Metric: Invalid Traffic (IVT)
      6. Metric: Permissions
      7. Metric: Programmatic Reach
      8. Metric: User Engagement
      9. Metric: Viewability
      10. How app categories are determined
    2. Rankings
      1. Rating Publishers With Diverse Dynamics
        1. Challenges
      2. Clustering-Based Generative Non-Linear Model
  5. FAQs
  6. Data Appendix
    1. North America
    2. EMEA
    3. APAC
    4. LATAM
    5. Google Play Store
    6. Apple App Store
    7. Roku Channel Store
    8. Amazon Fire TV App Store

Stats

Various statistics & charts from the Publisher Trust Indexes for both CTV and Mobile

5M+

mobile apps analyzed

20+

IAB 2.2 mobile app categories

200+

unique indexes

60K+

CTV apps analyzed

15+

CTV app categories

4

global regions

The Data Science Team

Pixalate's data science team invested years of R&D into devising a comprehensive ratings & ranking system grounded in data

Amin Bandeali
Amin Bandeali
Chief Technology Officer

Bandeali oversees the technology, engineering, and data teams at Pixalate. He holds an MSE in Software Engineering & a BSc in Computer Science. He co-founded Pixalate in 2012.

9 Years
At Pixalate
angelos
Angelos Lazaris
Chief Data Scientist

Lazaris leads Pixalate's data science and research teams at Pixalate. He holds a PhD in Electrical Engineering and an MSc and BS in Electronic and Computer Engineering. He joined Pixalate in 2014.

8 Years
At Pixalate
Melwin Poovakottu
Melwin Poovakottu
Data Scientist

Poovakottu develops data analysis framework models. He holds MS degrees in Information & Data Science and Engineering Management & Computer Management. He joined Pixalate in 2019.

2 Years
At Pixalate

Overview: Publisher Trust Indexes

Pixalate's Publisher Trust Index reports present the rank order of various Mobile and CTV apps across broad geographical regions (including NA, EMEA, APAC, and LATAM), publisher categories (e.g., News and Media, etc.), and Operating Systems (OS).

In the indexes, publishers are ranked for their overall quality in terms of programmatic inventory, invalid traffic (IVT), viewability, and more by being assigned an overall score from 0 to 99, incorporating all of the individual scores in each metric. The geographical regions of each index correspond to the location where the impression was generated (i.e., the location of the end-user) and not the location of the publisher which, quite often, is obfuscated.

In order to produce the various rankings, Pixalate analyzed more than 2 trillion data points over a period of one month from advertising across more than 150 countries.

Mobile Publisher Trust Indexes

The Mobile Publisher Trust Index provides ratings for various combinations of the following data points:

App Store Name: The App Store name characterizes where the publisher apps can be downloaded from. Currently only the “Apple App Store” and “Google Play Store” are supported. 

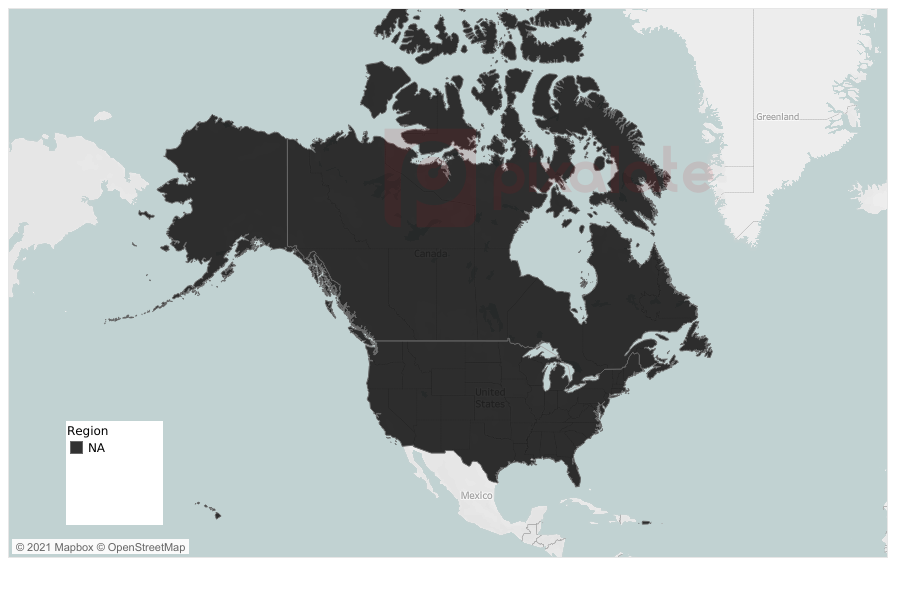
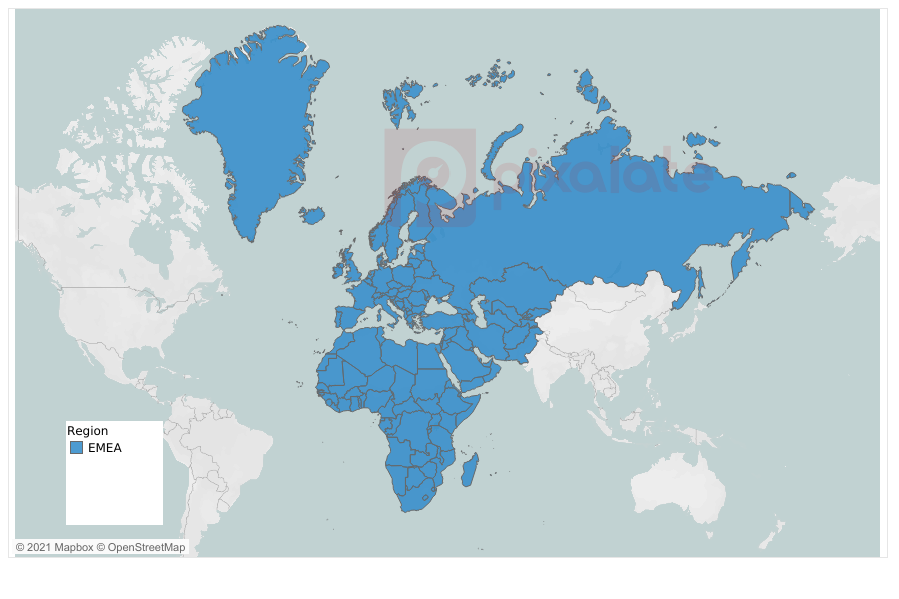
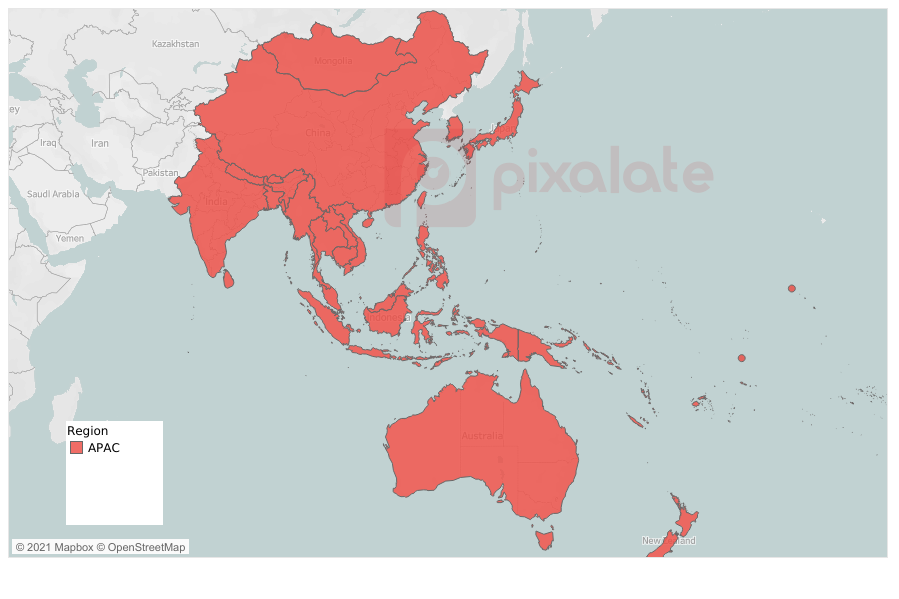
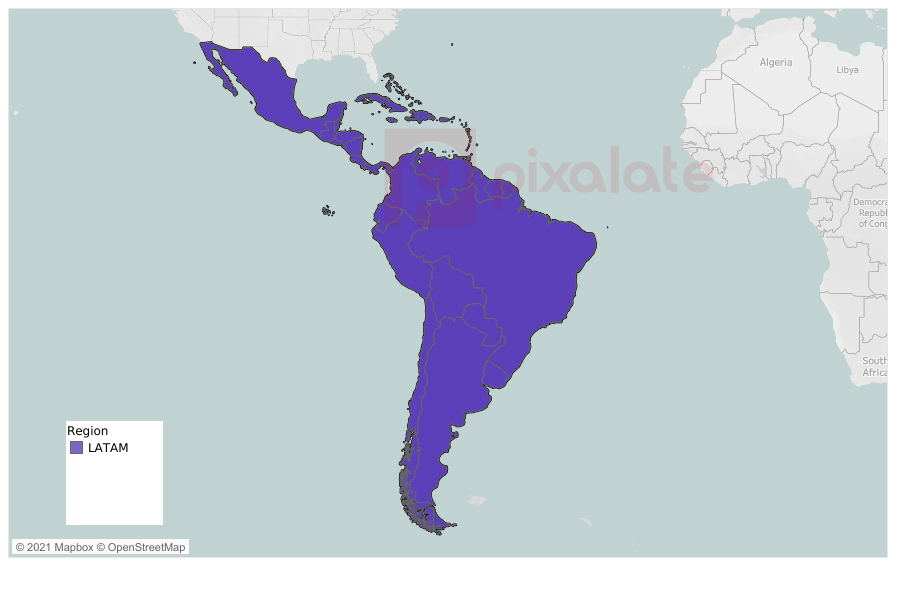
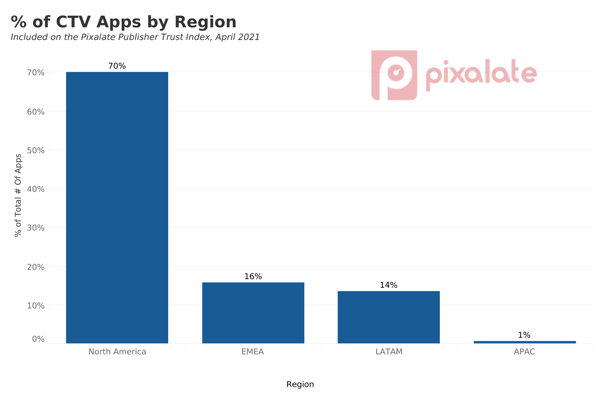
mpti-april-21-platformRegion Name: The name of the broader geographical region in which the end-user resides (i.e., this is essentially the location of the end-user generating impressions on a given publisher). The following regions are supported, and the countries that correspond to each region are defined in Appendix 1:

  • North America (NA)
  • Latin America (LATAM)
  • Europe, the Middle East and Africa (EMEA)
  • Asia Pacific (APAC)

mpti-april-21-regionCategory: This is the category of the publisher (e.g., News and Media, etc.). An “All” category is added to rank publishers across all the categories of a given app store. Categories are determined using the IAB taxonomy.
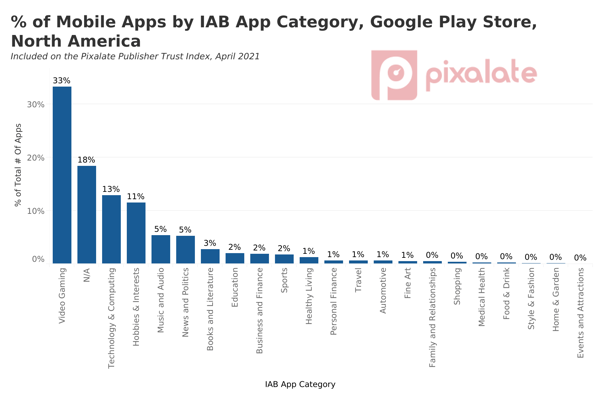
mpti-april-21-google-category-naThe main columns used to identify a publisher are the “appId'' and the “title”. AppID is unique for a given app store. For every appId, the following metrics are produced, characterizing its score compared to other publishers:
  Metrics Used on the Publisher Trust Index for Google Play Store apps

- Programmatic Reach Score: This score corresponds to a composite measure of programmatic popularity that is calculated in terms of both reach and inventory availability. It is a number between 0 to 99 indicating how extensive user coverage and inventory an app has compared to its competitors.

- IVT Score: This score corresponds to the percentage of IVT of the publisher compared to other publishers in a given category and GEO (i.e., other publishers in the same category).

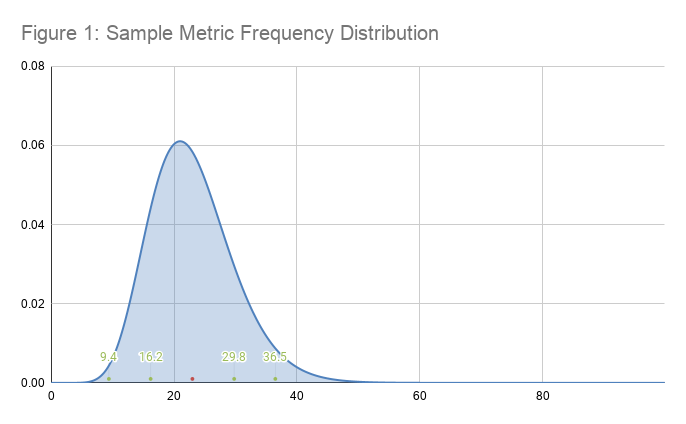
- Ads.txt Score: This score corresponds to the detected presence of ads.txt for a given publisher, as well as the presence of a “balanced” mix of sellers and resellers compared to its competitors. For this, Pixalate has developed a methodology for building a scoring curve for ads.txt that assigns a score for each combination of total sellers and resellers for a given publisher. The main rationale is that too many resellers may increase the risk for IVT, and too few sellers or resellers may limit the availability of the app's inventory to the open programmatic marketplace (see, for example, Figure 1. grading curve). A balanced combination of the two may provide the best results.

- Brand Safety Score: This score captures brand unsafe keywords or brand unsafe advisories declared by a given app in their app store page.

- Permissions Score: This score corresponds to the increase in the likelihood of the presence of IVT when specific permissions are given to a given app that are not common for its category. Permissions that can be risky for a given category might be necessary for the operation of the app in another category, and this kind of information is taken into consideration in order to derive this score. Note: this score is currently only available for Android.

- Viewability Score: This score corresponds to the performance of the app in terms of its viewability.

- Rank: This corresponds to the rank order of the publisher compared to its competitors within a given app store, category, and region combination.

- Final Score: This score corresponds to the average of all the individual scores mentioned above.

figure1_sample

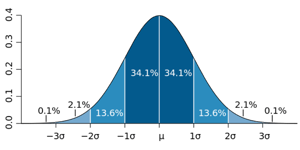
Figure 1. An example of a bell grading curve. If “μ” corresponds to the best value for the x-axis (e.g., number of direct sellers), then As and Bs are going to be assigned to the publishers with values around μ+σ and μ-σ. On the other hand, if the best value on the x-axis is after 2σ (e.g. for the case of IVT), then the As will be assigned to the publishers in the right tail of the distribution.  

  Metrics Used on the Publisher Trust Index for Apple App Store apps

- Programmatic Reach Score: This score corresponds to a composite measure of programmatic popularity that is calculated in terms of both reach and inventory availability. It is a number between 0 to 99 indicating how extensive user coverage and inventory an app has compared to its competitors.

- IVT Score: This score corresponds to the percentage of IVT of the publisher compared to other publishers in a given category and GEO (i.e., other publishers in the same category).

- Ads.txt Score: This score corresponds to the detected presence of ads.txt for a given publisher, as well as the presence of a “balanced” mix of sellers and resellers compared to its competitors. For this, Pixalate has developed a methodology for building a scoring curve for ads.txt that assigns a score for each combination of total sellers and resellers for a given publisher. The main rationale is that too many resellers may increase the risk for IVT, and too few sellers or resellers may limit the availability of the app's inventory to the open programmatic marketplace (see, for example, Figure 1. grading curve). A balanced combination of the two may provide the best results.

- Brand Safety Score: This score captures brand unsafe keywords or brand unsafe advisories declared by a given app in their app store page. Apps with fewer brand safety risks will achieve a higher score in this category.

- Viewability Score: This score corresponds to the performance of the app in terms of its viewability. Apps with higher viewability will achieve a higher score in this category.

- Rank: This rank corresponds to the rank order of the publisher compared to its competitors within a given Platform Name and Category combination.

- Rank: This corresponds to the rank order of the publisher compared to its competitors within a given app store, category, and region combination.

- Final Score: This score corresponds to the average of all the individual scores mentioned above.

figure1_sample

Figure 1. An example of a bell grading curve. If “μ” corresponds to the best value for the x-axis (e.g., number of direct sellers), then As and Bs are going to be assigned to the publishers with values around μ+σ and μ-σ. On the other hand, if the best value on the x-axis is after 2σ (e.g. for the case of IVT), then the As will be assigned to the publishers in the right tail of the distribution.  

CTV Publisher Trust Indexes

The CTV Publisher Trust Indexes provides ratings for various combinations of the following data points:

Platform Name: the platform characterizing the mobile device (currently Roku and Fire TV are supported).

cpti-april-21-platformRegion Name: the name of the broader geographical region that the end-user resides (i.e., essentially the location of the end-user generating impressions on a given publisher). 

cpti-april-21-region

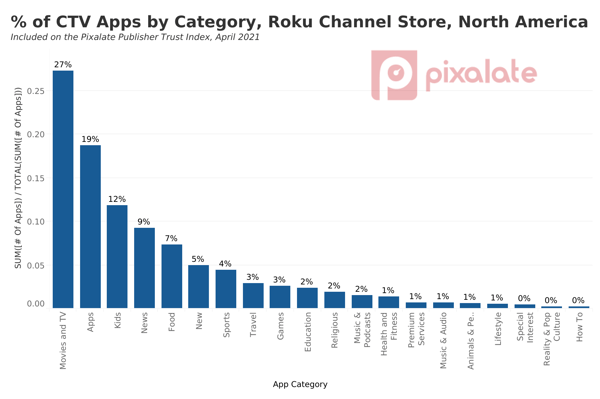
Primary Genre Name: This is the category of the publisher (e.g., News and Media, etc). An "All” category is added in order to rank publishers across all the categories of a given platform. Categories are defined using the app categories as provided by Roku and Amazon Fire TV, respectively.

cpti-april-21-roku-category-na

The main columns used to identify a publisher are the “appId'' and the “title”. AppID is unique for a given platform. For every appId, the following metrics are produced, characterizing its score compared to other publishers:
roku-logo  Metrics Used on the Publisher Trust Index for Roku Channel Store apps

- Programmatic Reach Score: This score corresponds to a composite measure of programmatic popularity that is calculated in terms of both reach and inventory availability. It is a number between 0 to 99 indicating how extensive user coverage and inventory an app has compared to its competitors. The score to grade assignment is shown in Table 1 below. Apps with more extensive user coverage compared to competitors will achieve a higher score in this category.

- IVT Score: This score corresponds to the percentage of IVT of the publisher compared to other publishers in a given category and GEO. Apps with less IVT will achieve a higher score in this category.

- Ad Density Score: This score characterizes the number of ads (i.e., ad density) per 10-minute video time. This can be seen as a tradeoff between maximization of revenue on the advertising ecosystem side while minimizing the user disturbance. Pixalate has developed a method for assigning scores to various ad density values. See Figure 2 in The Methodology of our Ratings & Metrics section for more.

- User Engagement Score: This score captures the user engagement with a given app in terms of time spent consuming content. Apps that have a higher average watch time will have a higher score in this category.

- Rank: This corresponds to the rank order of the publisher compared to its competitors within a given app store, category, and region combination.

- Final Score: This score corresponds to the average of all the individual scores mentioned above.

Fire TV  Metrics Used on the Publisher Trust Index for Amazon Fire TV apps

- Programmatic Reach Score: This score corresponds to a composite measure of programmatic popularity that is calculated in terms of both reach and inventory availability. It is a number between 0 to 99 indicating how extensive user coverage and inventory an app has compared to its competitors. The score to grade assignment is shown in Table 1 below. Apps with more extensive user coverage compared to competitors will achieve a higher score in this category.

- IVT Score: This score corresponds to the percentage of IVT of the publisher compared to other publishers in a given category and GEO. Apps with less IVT will achieve a higher score in this category.

- Ad Density Score: This score characterizes the number of ads (i.e., ad density) per 10-minute video time. This can be seen as a tradeoff between maximization of revenue on the advertising ecosystem side while minimizing the user disturbance. Pixalate has developed a method for assigning scores to various ad density values. See Figure 2 in The Methodology of our Ratings & Metrics section for more.

- User Engagement Score: This score captures the user engagement with a given app in terms of time spent consuming content. Apps that have a higher average watch time will have a higher score in this category.

- Rank: This corresponds to the rank order of the publisher compared to its competitors within a given app store, category, and region combination.

- Final Score: This score corresponds to the average of all the individual scores mentioned above.

Grades & Ratings Curve

For each index, in addition to assigning a ratings score for each metric, we also assign a letter grade based on those ratings scores. Hover over each letter grade to learn how the grades are assigned.

A-grade-publisher-trust-index
Score Range: 85-99
B-grade-publisher-trust-index
Score Range: 70-84
C-grade-publisher-trust-index
Score Range: 60-69
D-grade-publisher-trust-index
Score Range: 0-59

The Methodology of our Metrics & Ratings

This section presents the methodology used to generate scores for metrics that have more involved definitions and can lead to misinterpretation if not carefully defined. 

Pixalate Data Collection and Preprocessing

Pixalate collects data from various sources across the whole advertising ecosystem that range from ad agencies and DSPs, to SSPs, exchanges, and publishers. Specifically, Pixalate collects more than 2 Trillion data points from impression level data characterizing sellers, publishers and users across the globe. This gives us a unique vantage point that can leverage real measurement data in order to assess the quality of the various publishers and the level of trust that can be given by programmatic buyers.

Pixalate uses the following process to incorporate data for quality rankings:

  1. Data deduplication, which is the process of eliminating duplicates due to the same impression being tracked from various observation points (through different traffic sources). 
  2. Bias elimination, which is the process where the ad transaction data across various sources are normalized to eliminate any potential sampling biases.
  3. Data aggregation, which is the process of aggregating the data across various dimensions of interest such as publishers, platforms, or sellers.
  4. For the various rankings, only buy-side data are used in order to produce robust estimates that cannot be gamed by a malicious data provider. 

On top of the above steps, Pixalate processes data in terms of Invalid Traffic (IVT) as follows:

  1. Metrics that require non-IVT data (e.g. viewability) exclude all the IVT traffic flagged for a given publisher. 
  2. Metrics that require IVT data, exclude spoofed traffic in case it was determined that spoofing was victimizing the publisher for which metrics are derived.

Ad Density Rating

Definition of Ad Density
Pixalate defines Ad Density in CTV environments as the frequency at which video ads are displayed over a period of time. Thus, ad density can be represented as the ratio of the number of ads per minute, hour, or other unit of time. Pixalate uses a period of 10 minutes to express ad density since ad content is usually separated by 10-minute or less content viewing times. During these ad slots, usually 15- or 30-second ads are played, typically ranging from one to five ads per ad break. 
The Importance of Ad Density
Knowing the number of ads shown for a given app is essential for various reasons since it a) can allow for back-of-the-envelope calculations about revenue opportunities possible by working with a given publisher, b) it can give an estimate about how competitive the ad slots are for a given publisher (the less the slots, the higher the competition, especially for premium publishers), c) it can act as a proxy for calculating other metrics such as ad spend, and d) it can act as an additional filter for finding publishers with potentially disruptive advertising content that can affect engagement. 
Measuring Ad Density
Pixalate has developed a proprietary methodology to estimate the number of ads per 10 minute period for a given publisher. For this, Pixalate uses impression-level data across multiple tracked users and traffic suppliers in order to deduplicate impressions tracked multiple times and fill the blanks introduced by potential sampling. It is important to note that even if ads are shown less frequently than 10 minutes, we can still normalize the resulting ad density to 10-minute periods to allow for comparisons across publishers. For example, if a publisher shows six ads every 30 minutes, we can express that as six ads /30 mins = two ads/10 minutes. 
Ad Density Scoring
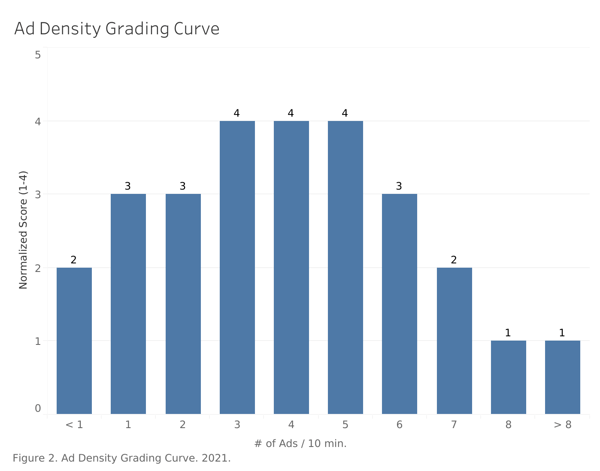
Ad Density can act as a tradeoff between maximizing advertising revenue while minimizing user disturbance. This means that from a purely financial perspective, the ad ecosystem has an incentive to show more ads at the publisher level to maximize its revenue. However, the more the ads are displayed to the user, the higher the user disruption, resulting in reduced user engagement, affecting the advertising revenue. So clearly, the two objectives need to be balanced by choosing a “sweet spot” or optimal operating point, and that is what Pixalate’s ad density grading methodology seeks to capture, as shown in Figure 2 and Table 2 below. As we can see in Figure 2, the best scores can be achieved for ad density 3-5 since it gives enough opportunity for advertising revenue without disrupting the content too much. Values less than three or more than 5 get lower scores.

ad-density-grading-curve3


Table 2: Ad Density Scoring Table

#Ads/10min

Normalized Score (1-4)

< 1

2

1

3

2

3

3

4

4

4

5

4

6

3

7

2

8

1

>9

1


Ads.txt Rating

Ads.txt score is a composite score that leverages information about 
  1. The presence of an ads.txt file (or app-ads.txt) for a given publisher, and 
  2. The type of entries that it contains in terms of direct sellers and resellers. 
 
Why is Ads.txt scoring so vital to the quality of  a publisher? Pixalate’s research supports a well-known industry belief that the number and type of entries in the ads.txt file can increase the likelihood for IVT for a given publisher, especially when the number of sellers and resellers are large. For this, Pixalate has developed a non-linear scoring framework like in Figure 3 that leverages training data in order to first group the publishers into clusters depending on their combination of sellers and resellers, and then assigns the best scores to the clusters with the lowest IVT. This way, ads.txt scoring can act as an additional indicator for future IVT risk, even if a publisher does not have high IVT today.

curve1


Figure 3.

Brand Safety Rating

The brand safety scoring metric of Publisher Trust Index indexes aims to capture apps with increased likelihood of adult, drug, violence, alcohol, hate speech, or gambling content. To do so, Pixalate relies on information from the two major app stores that characterize the app’s content advisory ratings, as well as text analysis on the description, title, or image captions. Examples of brand unsafe advisories include “Frequent/Intense Sexual Content or Nudity”, “Mature 17+”, “Adults only 18+”, etc.

IVT Rating

IVT scoring corresponds to the percentage of invalid traffic (IVT) of the publisher compared to its competition in a given category and geography.

Permissions Ratings

An app permission is a mechanism for controlling access to a system- or device-level function through the device’s operating system. Permissions can often have privacy implications (e.g., access to fine-grained location). App permissions help support user privacy by protecting access to the following:

- Restricted data, such as system state and a user's contact information.

- Restricted actions, such as connecting to a paired device and recording audio.

An Android app that needs to access sensitive data or functionality needs to specify the permissions it will need in the app manifest file (a file containing configuration information). Google has classified each permission according to its security level and its associated privacy risk. 
 
Permissions are needed for providing certain functionalities to mobile apps. For example, apps such as Google Maps need access to fine-grained GPS information in order to navigate the user to a given destination. However, a drawing app does not necessarily need fine-grained location data in order to operate. Motivated by this, permissions can be further classified as typical and atypical, depending on if they are needed in order to provide the services for which an app is intended. 
 

Typical and Atypical Permissions

 
Typical and Atypical permissions can usually be identified using the app category (or genre) as a proxy, since the most common permissions are usually present for all the apps of a given category. On the other hand, atypical permissions pose additional risk to end users because more permissions are given than appear to be required, thus making them potential avenues for generating IVT or conducting other malicious activities. 

 
Pixalate assesses each app permission in terms of the likelihood to be used for generating IVT. To do so, Pixalate detects permissions that correlate with higher IVT compared to the average IVT of a given app category. For example, within the list of navigation apps, the presence of location permission does not generally increase the odds of seeing higher IVT than usual in the category, since the permission is used by most the apps in the category. However, the presence of location permission in the category “games” (as an example) can be found to be associated with the app having higher IVT rates. Thus, we can flag the location permission in such cases as high risk. 
 
It is important to note here that Pixalate’s IVT permission score does not imply “causation.” Instead, it really measures “correlation.” What this means is that the presence of a given permission makes it more likely for the app to generate high rates of IVT, without necessarily implying that this permission is the one factor “causing” the IVT by itself, since more complex methods can be used (e.g. using multiple permissions in conjunction) to generate IVT.
 
Note: This rating is currently only available for Android apps.

Programmatic Reach Rating

Monthly Active Users (MAU) is a metric commonly used to characterize a publisher in terms of the users that have engaged with an app over a period of a calendar month or 30 days. MAU can be used as a metric that captures the growth of a given publisher. From the advertising perspective, MAU can be used as an upper bound of the number of distinct users that are expected to generate impressions assuming that all the user’s ad requests have been filled. However, since this might not be always the case, Pixalate has followed a different approach and defined programmatic MAU (pMAU) as the monthly active users that have generated programmatic traffic. 

In order to estimate the MAU (and its programmatic counterpart) for a given publisher, Pixalate has developed Machine Learning (ML) models that generate MAU predictions given various data points that characterize the publisher such as: a) app store information, b) user growth information, c) impression-level data, and d) various other composite metrics that are generated after removing any potential sampling biases in order to provide robust estimates. In the core of the MAU prediction system lies a modeling ensemble that combines predictions from many individual models and generates a single prediction for every given publisher.

User Engagement

User Engagement scoring captures the user engagement with a given app in terms of time spent consuming content.

Viewability Rating

Viewability scoring aims to score the performance of a given publisher in terms of the percentage of display impressions being viewed. For this score, Pixalate relies on its impression data and assigns scores in proportion to the viewability performance of a given publisher, after all the IVT has been removed (per MRC viewability guidelines).

How is an app category determined?

In order to determine the category of a given app, we rely on information shown in its app store page. In general, the categories listed in the app stores can be used without any further processing. However, there are two issues that need some additional handling: 

  1. The availability of more than one app categories for a given app, specifically for FireTV and Roku apps
  2. The availability of category name variations for certain apps (e.g. “News” vs “News and Media”)

The first issue is addressed by allowing an app to be ranked in multiple categories. This serves also the purpose of “discoverability” and allows it to be listed and ranked for various similar category filters used.

The second issue causes the formation of small categories (i.e. if the category variation is very unpopular) that can result in small or no competitors at all for a given app. Since this will result in less meaningful rankings for certain small categories, Pixalate has developed a category aggregation framework that merges small categories into a bigger parent one with the intent to produce more meaningful rankings. The full list of categories being merged under a parent one is shown in the following table: 

Aggregated Category

App Store Original Category

Apps

Accessories & Supplies, Activity Tracking, Alarms & Clocks, All-in-One Tools, Audio & Video Accessories, Battery Savers, Calculators, Calendars, Communication, Currency Converters, Customization, Device Tracking, Diaries, Digital Signage, Document Editing, File Management, File Transfer, Funny Pictures, General Social Networking, Meetings & Conferencing, Menstrual Trackers, Navigation, Offline Maps, Photo & Media Apps, Photo & Video, Photo Apps, Photo-Sharing, Productivity, Reference, Remote Controls, Remote Controls & Accessories, Remote PC Access, Ringtones & Notifications, Screensavers, Security, Simulation, Social, Speed Testing, Streaming Media Players, Themes, Thermometers & Weather Instruments, Transportation, Unit Converters, Utilities, Video-Sharing, Wallpapers & Images, Web Browsers, Web Video, Wi-Fi Analyzers

Beauty

Beauty & Cosmetics

Books

Book Info & Reviews, Book Readers & Players, Books & Comics

Business

Business, Business Locators, Stocks & Investing

Education

Education, Educational, Flash Cards, Learning & Education

Fashion & Style

Fashion, Style, Style & Fashion

Finance

Stocks & Investing

Food

Cooking & Recipes, Food, Food & Drink, Food & Home, Wine & Beverages

Games

Arcade, Board, Bowling, Brain & Puzzle, Cards, Casino, Game Accessories, Game Rules, Games & Accessories, Jigsaw Puzzles, Puzzles, Racing, Role Playing, Standard Game Dice, Strategy, Trivia, Words

Health and Fitness

Exercise, Exercise Motivation, Fitness, Health & Fitness, Health & Wellness, Meditation Guides, Nutrition & Diet, Workout, Workout Guides, Yoga, Yoga Guides

How To

Guides & How-Tos

Kids

Kids & Family

Lifestyle

Crafts & DIY, Furniture, Home & Garden, Hotel Finders, Living Room Furniture, Sounds & Relaxation, TV & Media Furniture, Wedding

Movies & TV

Action, Adventure, Cable Alternative,Classic TV, Comedy, Crafts & DIY, Crime & Mystery, Filmes & TV, International, Movie & TV Streaming, Movie Info & Reviews, Movies & TV, On-Demand Movie Streaming, On-Demand Music Streaming, Reality & Pop Culture, Rent or Buy Movies, Sci & Tech, Television & Video, Television Stands & Entertainment Centers, Top Free Movies & TV, TV en Español

Music & Audio

Instruments & Music Makers, MP3 & MP4 Players, Music, Music & Rhythm, Music Info & Reviews, Music Players, Portable Audio & Video, Songbooks & Sheet Music

New

New, New & Notable, New & Updated, Novelty

News

Celebrities, Feed Aggregators, Kindle Newspapers, Local, Local News, Magazines, New & Notable, News & Weather, Newspapers, Podcasts, Radio, Weather, Weather Stations

Premium Services

Most Watched, Top Paid, Featured, 4K Editors Picks, Just Added, Most Popular, Top Free, Recommended

Religious

Faith-Based, Religião, Religion & Spirituality, Religious

Sports

Baseball, Cricket, Extreme Sports,Tennis, Golf, Pool & Billiards, Soccer, Sports & Fitness, Sports Fan News, Sports Games, Sports Information

Travel

Travel Guides, Trip Planners


The category aggregation above can produce meaningful large categories. However, in cases of small countries with limited numbers of apps generating advertising traffic, it is possible to have categories with a small number of apps. For this, Pixalate uses a threshold of 30 apps minimum per country and category combination in order to produce publisher rankings.

The Methodology of our Rankings

Introducing the Clustering-Based Generative Non-Linear Model

Rating Publishers With Diverse Dynamics

Publisher Trust Index Ratings introduce an additional scoring layer that combines individual scores into a single final score that is used to rank publishers. The main idea here is that we can use a single score to capture many different metrics together and provide a holistic view of a publisher, and then use this to rank publishers and compare their overall performance. 

Challenges

Even though the main idea of quality Ratings is simple, it is extremely challenging due to:

  1. The number of publishers to be ranked, and 
  2. The diverse dynamics of the publishers in terms of scale, performance, and quality overall. As a consequence, traditional weighted average models would not work, especially when using normalized metrics such as IVT, viewability, ad density etc. For example, if one had to choose between a publisher with 5% IVT and 1M MAU, and a publisher with 10% IVT and 2M MAU, which one would be preferable? Things can become even more challenging if we also incorporate low-IVT small publishers (e.g. 0.01% IVT with 10K MAU). 

In order to overcome the above challenges, Pixalate has developed a hierarchical approach that provides: 

  1. A global comparison of all the entities to be ranked (e.g. all the categories together), and 
  2. Ratings within various “segments” of the data, such as combinations of various platforms/OS,  GEO,  and categories. 

The rationale is that comparisons within such segments are more meaningful and usually the consumer of such Ratings usually focuses on one segment at a time. However, rating publishers within a segment can still create challenges due to the very diverse dynamics of the publishers in terms of scale, performance, and quality overall. For this, Pixalate has developed a novel framework for ranking thousands or millions of publishers by introducing a Clustering-Based Generative Non-Linear Model that leverages a clustering algorithm in order to:

  1. Group similar publishers together, 
  2. Rank the clusters according to a distance metric, and 
  3. Produce within-cluster Ratings. 

Clustering-Based Generative Non-Linear Model

The resulting clustering framework can be summarized in the following steps:

    1. Data Preprocessing: In this phase, the ad transaction data across various sources are deduped and normalized to eliminate any potential sampling biases, and then they are aggregated at the publisher level across the various dimensions of interest (such as app store name, or country code).
    2. Clustering Phase: This phase groups the publishers into similarity groups (i.e., clusters) using their individual attributes such as popularity, IVT, viewability, etc. This way, only apples to apples are compared with each other.
    3. Inter-Cluster Ranking Phase: In this phase, all the clusters are ranked using a multidimensional distance scoring function that produces an ordering of all the clusters depending on their cluster centroids (essentially capturing their average IVT, popularity, ad density, etc.). 
    4. Intra-Cluster Scoring and Ranking Phase: In this phase, individual publisher metrics are scored from 0 to 99. An average score is then calculated for each publisher and the individual publishers are then ranked within their cluster. 
    5. Score Normalization: In this phase, all the scores are normalized on a global scale, for each segment of the data (i.e., combination of platform/OS, GEO, and category).
    6. Final Ranking Phase: In this phase, all the clusters and their members are sorted according to their scores.

FAQs

Data Appendix

The Pixalate Top 100™ rankings can be sliced by global region and by app category. Choose a pivot below to learn more about the data associated with the related indexes. 

North America

NA-highlight

EMEA

EMEA-highlight

APAC

APAC-highlight

LATAM

LATAM-highlight

Google Play Store

gps-6x9

Apple App Store

apple-6x9

Roku Channel Store

roku-6x9

Fire TV App Store

amazon-6x9

Global - Publisher Trust Index data

mobile-apps-region-global-cover
mobile-apps-platform-global-cover
ctv-apps-region-global-cover
ctv-apps-platform-global-cover

North America - Publisher Trust Index data

See which countries are assigned to North America here

mobile-apps-platform-na-cover
mobile-apps-android-category-na-cover
mobile-apps-ios-category-na-cover
ctv-apps-platform-na-cover
ctv-apps-roku-category-na-cover
ctv-apps-amazon-category-na-cover

EMEA - Publisher Trust Index data

See which countries are assigned to EMEA here

mobile-apps-platform-emea-cover
mobile-apps-android-category-emea-cover
mobile-apps-ios-category-emea-cover
ctv-apps-platform-emea-cover
ctv-apps-roku-category-emea-cover
ctv-apps-amazon-category-emea-cover

APAC - Publisher Trust Index data

See which countries are assigned to APAC here

mobile-apps-platform-apac-cover
mobile-apps-android-category-apac-cover
mobile-apps-ios-category-apac-cover
ctv-apps-platform-apac-cover
ctv-apps-roku-category-apac-cover
ctv-apps-amazon-category-apac-cover

LATAM - Publisher Trust Index data

See which countries are assigned to LATAM here

mobile-apps-platform-latam-cover
mobile-apps-android-category-latam-cover
mobile-apps-ios-category-latam-cover
ctv-apps-platform-latam-cover
ctv-apps-roku-category-latam-cover
ctv-apps-amazon-category-latam-cover

Google Play Store - Publisher Trust Index data

google-apps-region-cover
google-apps-category-global-cover
google-apps-category-na-cover
google-apps-category-emea-cover
google-apps-category-apac-cover
google-apps-category-latam-cover

Apple App Store - Publisher Trust Index data

apple-apps-region-cover
apple-apps-category-global-cover
apple-apps-category-na-cover
apple-apps-category-emea-cover
apple-apps-category-apac-cover
apple-apps-category-latam-cover

Roku Channel Store - Publisher Trust Index data

roku-apps-region-cover
roku-apps-category-global-cover
roku-apps-category-na-cover
roku-apps-category-emea-cover
roku-apps-category-apac-cover
roku-apps-category-latam-cover

Amazon Fire TV App Store - Publisher Trust Index data

amazon-apps-region-cover
amazon-apps-category-global-cover
amazon-apps-category-na-cover
amazon-apps-category-emea-cover
amazon-apps-category-apac-cover
amazon-apps-category-latam-cover

Disclaimer

The content of this document, and the Publisher Trust Indexes (collectively, the "Indexes"), reflect Pixalate's opinions with respect to factors that Pixalate believes may be useful to the digital media industry. The Indexes examine programmatic advertising activity on mobile apps and Connected TV (CTV) apps (collectively, the “apps”). As cited in the Indexes, the ratings and rankings in the Indexes are based on a number of metrics (e.g., “Brand Safety”) and Pixalate’s opinions regarding the relative performance of each app publisher with respect to the metrics. The data is derived from buy-side, predominantly open auction, programmatic advertising transactions, as measured by Pixalate. The Indexes examine global advertising activity across North America, EMEA, APAC, and LATAM, respectively, as well as programmatic advertising activity within discrete app categories. Any insights shared are grounded in Pixalate's proprietary technology and analytics, which Pixalate is continuously evaluating and updating. Any references to outside sources in the Indexes and herein should not be construed as endorsements. Pixalate's opinions are just that, opinions, which means that they are neither facts nor guarantees; and neither this press release nor the Indexes are intended to impugn the standing or reputation of any person, entity or app.

Definitions

As used in the Indexes and herein, and: (i) per the MRC, the term “'Fraud' is not intended to represent fraud as defined in various laws, statutes and ordinances or as conventionally used in U.S. Court or other legal proceedings, but rather a custom definition strictly for advertising measurement purposes;” and (ii) per the MRC, “'Invalid Traffic' is defined generally as traffic that does not meet certain ad serving quality or completeness criteria, or otherwise does not represent legitimate ad traffic that should be included in measurement counts. Among the reasons why ad traffic may be deemed invalid is it is a result of non-human traffic (spiders, bots, etc.), or activity designed to produce fraudulent traffic.”