-1.png?width=150&height=60&name=pixalate-full-logo%20(1)-1.png)
Dashboard
-
The Dashboard Report and related reporting functionality (maintained across the Standard Reports presented below) is presented in additional detail on the Analytics Reporting Overview page.
-
Additional detail on a metric/dimension level is presented in the Reported Metrics and Reporting Dimensions pages.
Note: For advanced reports, the window of data that can be retrieved is the last 60 days as of this writing. This may change in the future, in which case please reach out to your Customer Success representative for questions or custom data retrievals (if available).
Domains
- Default 'Domains' report presents the distribution of aggregate traffic across individual domain URL.
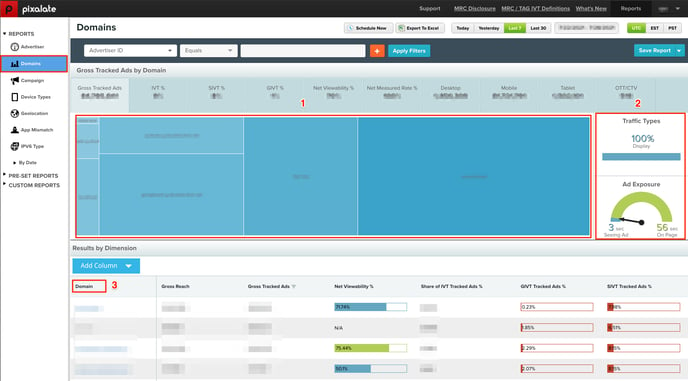
- (1) Distribution of aggregate impression traffic across individual domain URLs. Discrete domain-level metric insights are presented by hovering over a domain within this breakout. Darker color and bigger size represents more impressions.
- (2) Distribution of aggregate impression traffic by traffic types and ad exposure times.
- (3) Default metric breakdown by domain; Metrics and Dimensions can be added and removed via the 'Apply Filters' or 'Add Column' reporting features.
- Refer to the Analytics Reporting Overview page for additional detail regarding the reporting functionality available.
Note that the Domains report in the Standard Reports (or simply Reports) section in the Analytics dashboard includes values that are "not set" or null.
This is in contrast with the By Domain report in the Pre-Set Reports where "not set" or null values are filtered out.
This can cause discrepancies in reporting on comparison if null values exists in the domain data set measured.
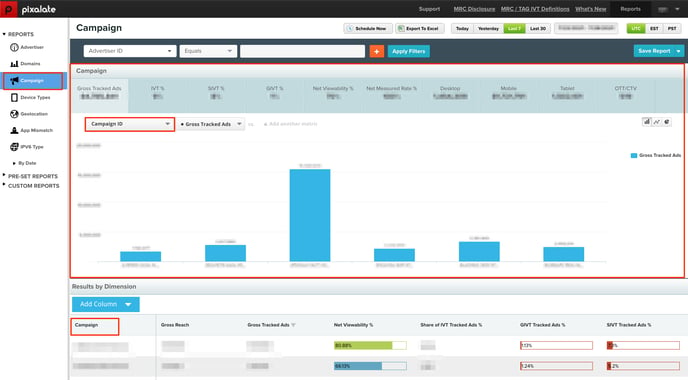
Campaign
Device Types
- Default 'Device Types' report presents the distribution of aggregate impression traffic across individual device environments (mobile, desktop, tablet, connected tv/ott).
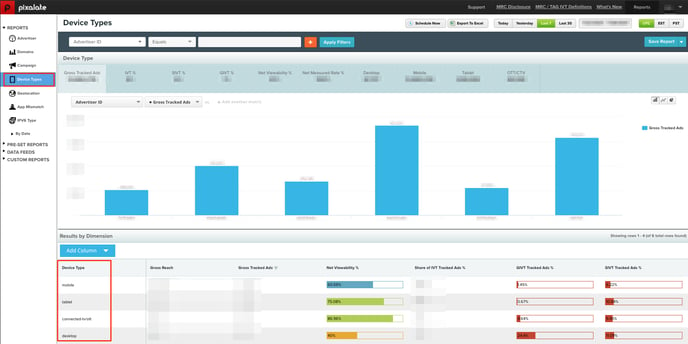
- Distribution of aggregate traffic by device type (mobile, desktop, tablet, connected tv/ott); standard graph formats accessible.
- Refer to the Analytics Reporting Overview page for additional detail regarding the reporting functionality available.
Filtered on 'Device Type'
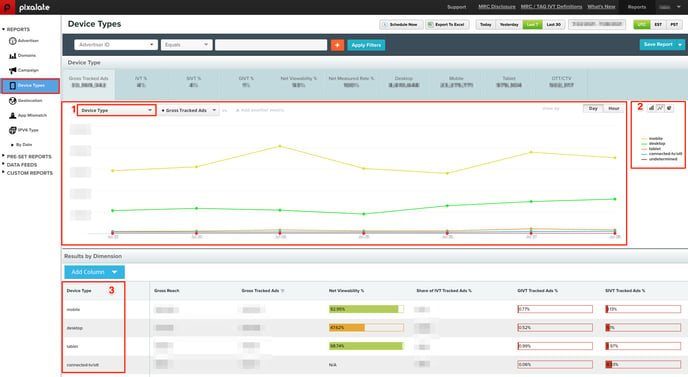
- (1) Distribution of aggregate traffic; filtered on Device Type dimension; standard graph formats accessible (2), line graph format presented above can be viewed by day or by hour.
- (3) Default metric breakdown by device type (mobile, desktop, tablet, connected tv/ott); Metrics and Dimensions can be added and removed via the 'Apply Filters' or 'Add Column' reporting features.
- Refer to the Analytics Reporting Overview page for additional detail regarding the reporting functionality available.
Geolocation
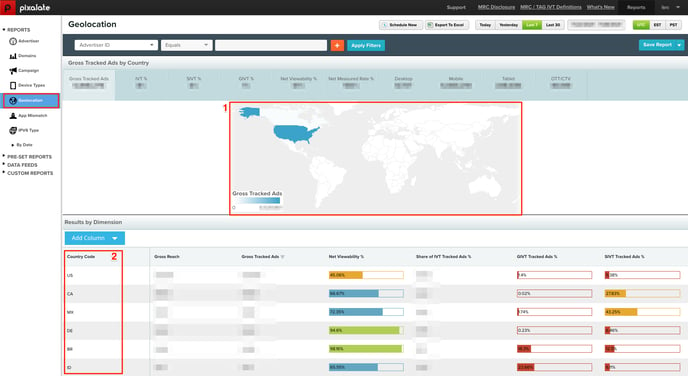
- (1) Map distribution of aggregate traffic by Geolocation based on Country Code. Discrete metric insights are accessible by hovering over a country within the graph.
- (2) Default metric breakdown by Country Code. Metrics and Dimensions can be added and removed via the 'Apply Filters' or 'Add Column' reporting features.
- Refer to the Analytics Reporting Overview page for additional detail regarding the reporting functionality available.
App Mismatch
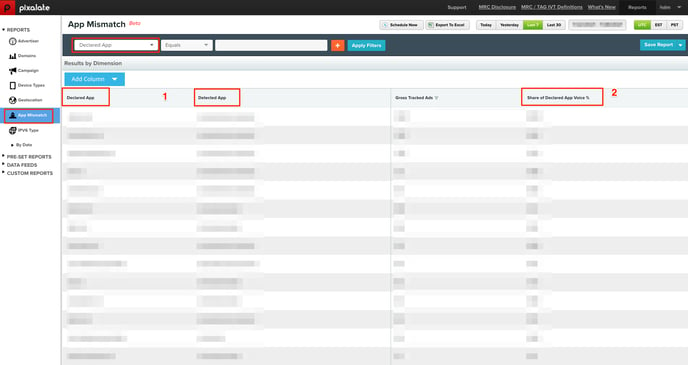
- (1) The “Declared App” is a data point passed to Pixalate via macro, while the “Detected App” is determined using header information.
- (2) Share of Declared App Voice % - This percentage shows how often a specific “Declared App” and “Detected App” combination occurs across all impressions for the respective “Declared App”.
IPV6 Type
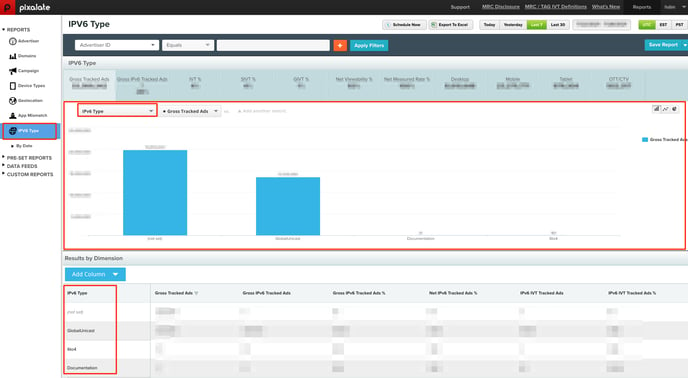
- In addition to the standard metrics and dimensions available in the IPv6 report, this also contains "IPv6 Type" which adds another layer of dimensionality for IVT technical deep-dives and contrasting against network-level traffic.
- For more information on IPv6 types, visit our dedicated article here.