-1.png?width=150&height=60&name=pixalate-full-logo%20(1)-1.png)
Based on comprehensive programmatic traffic data, these metrics can assist in measurement, campaign analysis, engagement optimization, and general advertising strategies.
Here’s how you can effectively interpret the information in this widget:
Audience Engagement
This section shows how users interact with the app in the programmatic ad space over a 30-day window, covering visitor volume, return frequency, and engagement depth. These observed metrics collectively provide a comprehensive view of audience activity and programmatic insights.
- Monthly Active Users: Count of unique programmatic users active in the app over a 30-day window; helps businesses measure reach and audience size.
- Retention Rate: Percentage of programmatic users who return to the app within a 30-day window; helps businesses understand user stickiness and loyalty over time.
- Total Sessions: Number of visits recorded over a 30-day window; reflects overall traffic and potential ad exposure. A “session” is defined as a single visit to the app, including all continuous interactions within a 30-minute window.
- Sessions per User: Frequency of return visits over a 30-day window; may indicate loyalty and app stickiness.
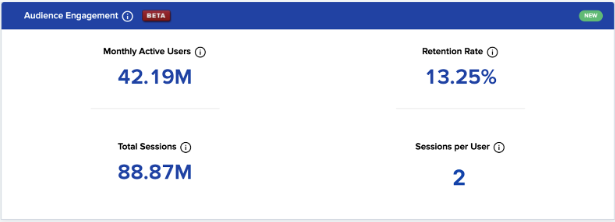
Figure 1. A portion of the Audience Engagement widget displaying metrics on how often and how long users interact with an app over a 30-day window.
Ad Performance
This section provides a clear breakdown of how ads have performed in the app within the programmatic ad space over a 30-day window. Key metrics include:
- Native vs. Interstitial Ads: The distribution of ad formats served in a 30-day window. This information can help businesses understand which ad types are driving engagement and support with optimizing future ad placements.
- Ads per Session: The average number of ads delivered per session over a 30-day window; helps businesses measure ad density within user sessions and balance monetization with user experience.
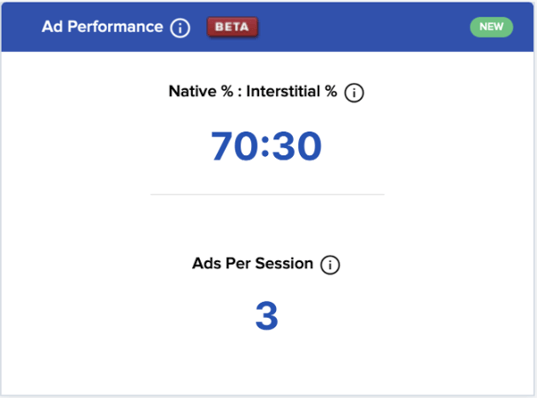
Figure 2. Ad performance for a 30-day window.
All Audience Engagement data displayed in MRT reflect observed programmatic traffic from a 30-day window. Leveraging these insights can help businesses significantly enhance their understanding of audience behavior, improve user experience, and optimize ad revenue strategy. Additionally, please note that these insights represent Pixalate’s opinions (not definitive facts) based on its analysis of programmatic traffic data.
Need More Help?
For any questions or further assistance, please reach out to our support team.