-1.png?width=150&height=60&name=pixalate-full-logo%20(1)-1.png)
Dashboard Report
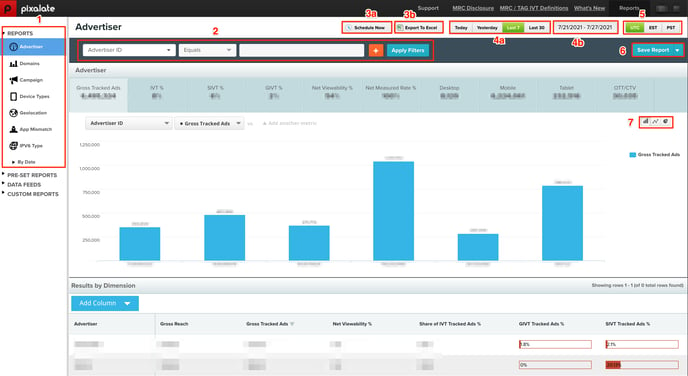
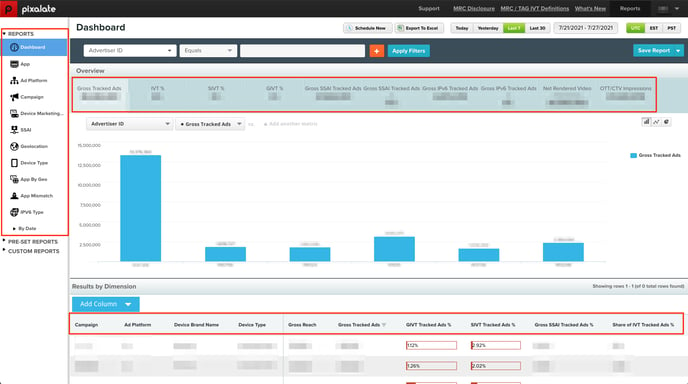
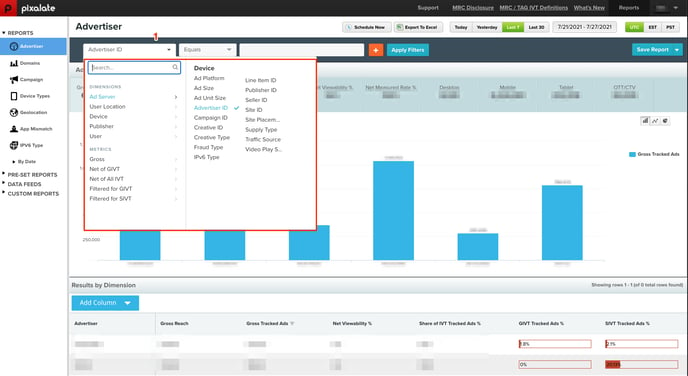
- Default View upon login to Pixalate's Analytics Platform is the Dashboard Report (1), through which dynamic insights into Pixalate-tagged media are offered to clients through customizable filters at a metric and reporting dimension level.
- The Dashboard Toolbar (2) enables clients to filter on customizable reporting dimensions and metric fields. While reporting dimensions/metrics can also be added and removed through the 'Add Column' option in the 'Result by Dimension' breakout (see below), discrete filtering is facilitated through the Dashboard Toolbar (2).
- Standard Analytics Reporting Periods (4a) include Today, Yesterday, Last 7 Days, and Last 30 Days, although this is customizable via the Date Range function (4b).
- Standard Analytics Reporting Time Zones (5) include UTC, EST, and PST, which clients can toggle at any time. Reporting Time Zone is set to UTC by default.
- Graphical Representations (7) for selected Dimensions and Metrics can be toggled between a Bar Graph, Line Graph and Pie Chart.
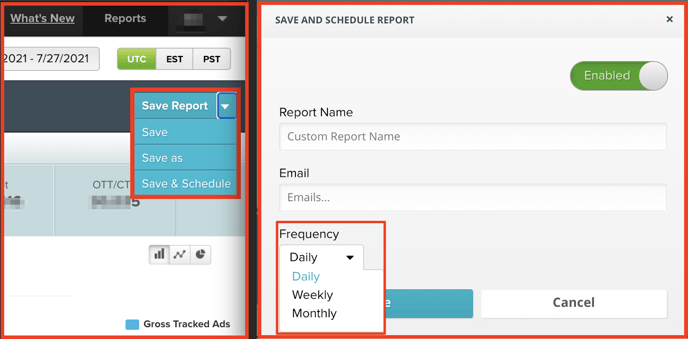
- Reports can be Saved (6), Exported (3b), Scheduled (3a) or Saved and Scheduled via (3a) and (6) directly from the Dashboard Report or through this same functionality within any other Default Report. Scheduled reports can be set to run at a Daily, Weekly or Monthly cadence.
Dashboard OTT/CTV Reports
Dashboard Pre Set Reports
Reported Metrics/Dimensions
- Reporting Dimensions and Metrics can be filtered through the (1) Filter Functionality in the Dashboard. There is no limit on how many Dimensions and Metrics can be filtered.
- Access Reporting Dimensions by selecting 'Apply Filters'
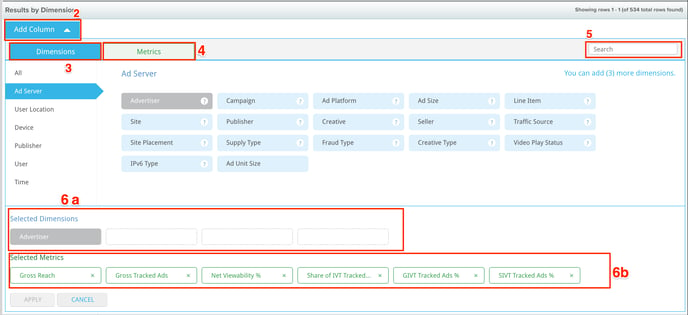
- Reporting Dimensions (3) and Metrics (4) can be added to the reporting grid through (2) 'Add Column' option via Results by Dimension.
- Dimensions and Metrics can also be searched from search feature (5)
- Generate Analytics reports with up to 6 Metrics (6b) and 4 Dimensions (6a) at once.
Add Column - Dimensions
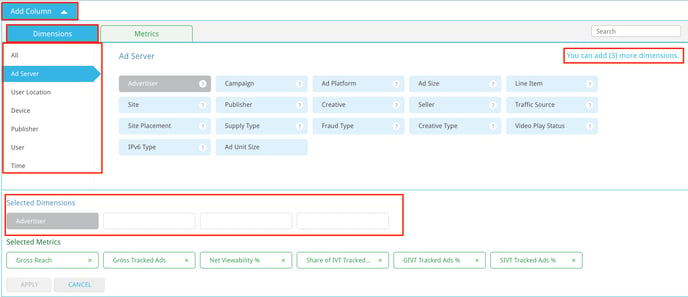
- Select 'Add Column' via 'Results by Dimension' as denoted above.
- Up to (4) Reporting Dimensions can be added per report view.
- Visit the Reporting Dimensions page to view each of the reporting dimensions available and their accompanying definitions.
Dimensions
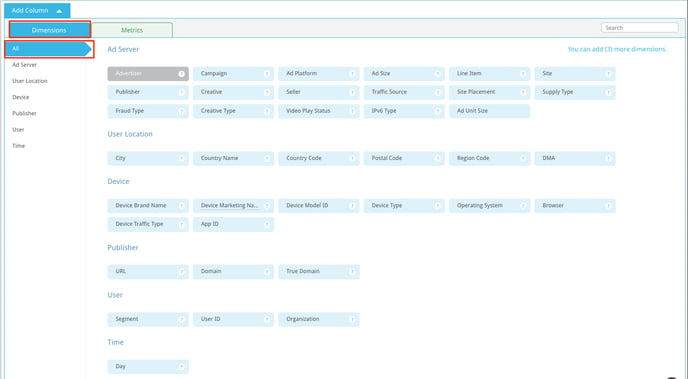
- Dimensions available include attributes reported across the following sub-categories:
- Ad Server
- User Location
- Device
- Publisher
- User
- Time
Add Column - Metrics
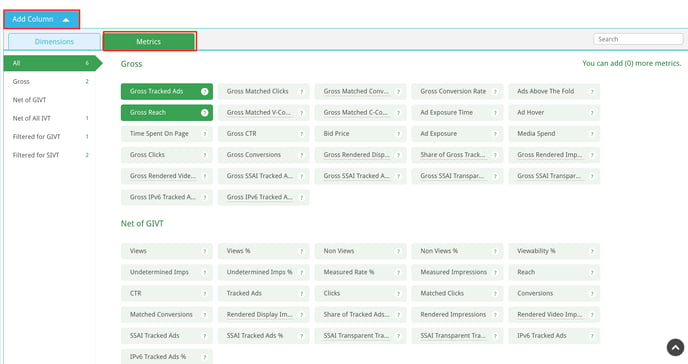
- Access Reporting Dimensions by selecting 'Apply Filters' (as denoted in the previous screenshot) or select 'Add Column' via 'Results by Dimension' as denoted above.
- Visit the Reported Metrics page to view each of the reported metrics available and their accompanying definitions.
- Up to (6) Metrics can be added per report view.
Metrics
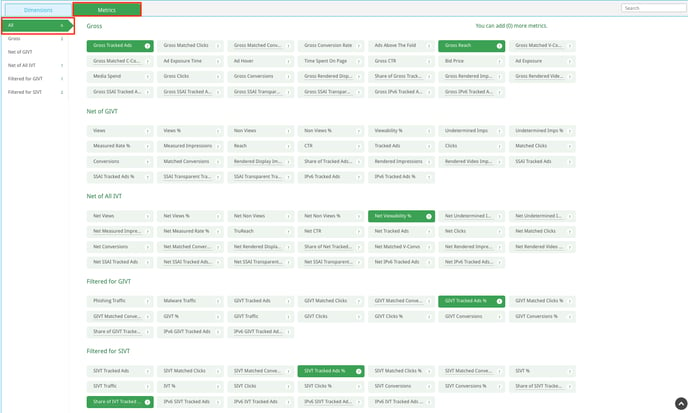
- Metric breakouts are available across the following sub-categories:
- Gross - Before removal of General Invalid Traffic (GIVT) or Sophisticated Invalid Traffic (SIVT)
- Net of GIVT - After removal of General Invalid Traffic (GIVT)
- Net of All GIVT - After removal of General Invalid Traffic (GIVT) and Sophisticated Invalid Traffic (SIVT)
- Filtered for GIVT - General Invalid Traffic insights
- Filtered for SIVT - Sophisticated Invalid Traffic (SIVT) insights