Connected TV (CTV) Device Market Share | September 2026 | Pixalate
Pixalate Research · CTV Market Intelligence · September 2026

Connected TV device market share: the top CTV devices globally, by region, and by country

Last Updated: October 7, 2026 Data Period: September 2026
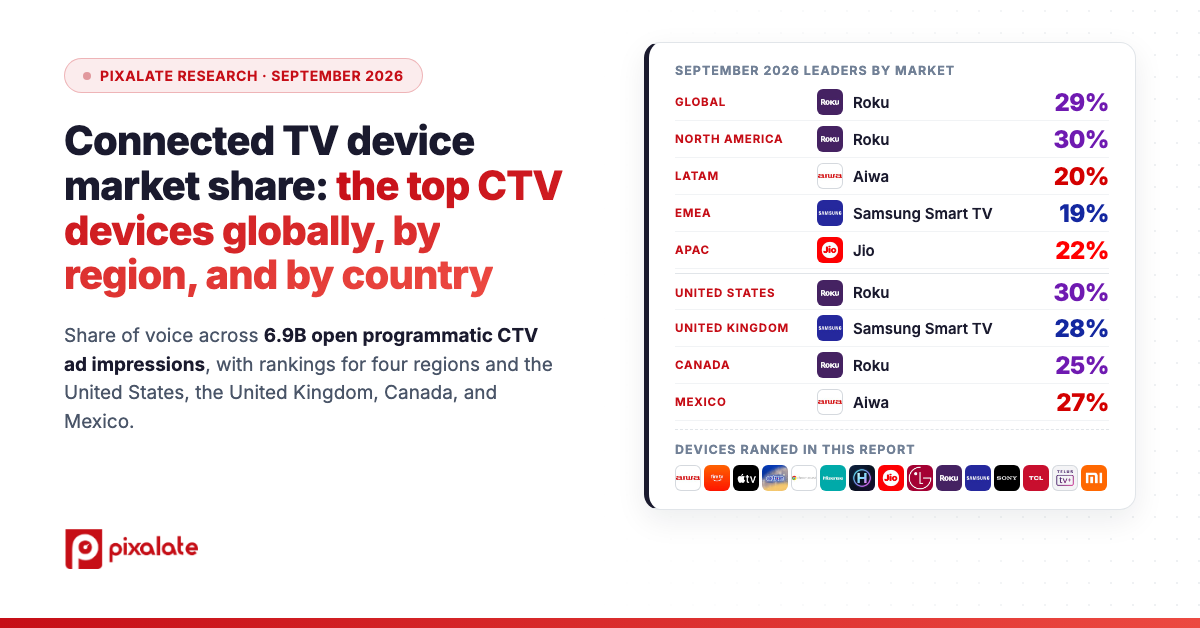
  • Roku leads CTV globally and in North America. Roku devices received 29% of open programmatic CTV ads worldwide in September 2026, and led in North America (30%), the United States (30%), and Canada (25%). See more →
  • Samsung Smart TV leads EMEA and the United Kingdom. Samsung Smart TV’s share of voice in September 2026 was 19% in EMEA and 28% in the United Kingdom. See more →
  • Jio leads APAC. Jio’s share of voice in APAC was 22% in September 2026, and ranged from 22% to 27% between June and September 2026. See more →
  • Aiwa leads LATAM and Mexico. Aiwa’s share of voice in September 2026 was 20% in LATAM and 27% in Mexico. See more →
  • Amazon Fire TV gained share month over month. Amazon Fire TV’s global share of voice rose from 19% in August to 26% in September 2026, and from 19% to 27% in the United States. See more →
  • This report ranks the top 5 connected TV (CTV) devices by their share of open programmatic advertising, globally, in four regions, and in four countries.
  • Every figure is share of voice (SOV): the share of sold open programmatic CTV ads delivered to a given device.
  • SOV measures ad delivery, not device sales, installed base, or households.
  • Global rankings, plus North America, Latin America, Europe, Middle East & Africa, and Asia Pacific.
  • Countries: the United States, the United Kingdom, Canada, and Mexico.
  • CTV devices only, identified by manufacturer or platform. Devices with no identified manufacturer are excluded.
  • Rankings: September 2026. Time series: Jun 2026 to Sep 2026, across 6.9B open programmatic CTV ad impressions.
  • Region and country are determined from detected IP address and other identifiers.
  • Percentages are rounded to whole numbers; devices are ranked on unrounded values.
Research Scope
Open programmatic CTV impressions
6.9B
Markets ranked: global, 4 regions, 4 countries
9 markets
Devices ranked in this report
AiwaAmazon Fire TVApple TVAstronChromecastHisenseHorizonJioLGRokuSamsung Smart TVSonyTCLTELUSXiaomi
Report
CTV Device Market Share
Period
September 2026
Rankings

Top 5 CTV Devices by Share of Voice

Roku
29%


Beyond the top 5See the full device rankings — contact Pixalate →

4 more devices in this breakdown are locked.Unlocking is free — it only takes your email address.Unlocking needs JavaScript. Enable it and reload the page, or contact Pixalate.Loading the full data…The full data couldn’t be loaded. Reload the page to try again, or contact Pixalate.

Roku
30%


Beyond the top 5See the full device rankings — contact Pixalate →

4 more devices in this breakdown are locked.Unlocking is free — it only takes your email address.Unlocking needs JavaScript. Enable it and reload the page, or contact Pixalate.Loading the full data…The full data couldn’t be loaded. Reload the page to try again, or contact Pixalate.

Samsung Smart TV
19%


Beyond the top 5See the full device rankings — contact Pixalate →

4 more devices in this breakdown are locked.Unlocking is free — it only takes your email address.Unlocking needs JavaScript. Enable it and reload the page, or contact Pixalate.Loading the full data…The full data couldn’t be loaded. Reload the page to try again, or contact Pixalate.

Jio
22%


Beyond the top 5See the full device rankings — contact Pixalate →

4 more devices in this breakdown are locked.Unlocking is free — it only takes your email address.Unlocking needs JavaScript. Enable it and reload the page, or contact Pixalate.Loading the full data…The full data couldn’t be loaded. Reload the page to try again, or contact Pixalate.

Aiwa
20%


Beyond the top 5See the full device rankings — contact Pixalate →

4 more devices in this breakdown are locked.Unlocking is free — it only takes your email address.Unlocking needs JavaScript. Enable it and reload the page, or contact Pixalate.Loading the full data…The full data couldn’t be loaded. Reload the page to try again, or contact Pixalate.

Roku
30%


Beyond the top 5See the full device rankings — contact Pixalate →

4 more devices in this breakdown are locked.Unlocking is free — it only takes your email address.Unlocking needs JavaScript. Enable it and reload the page, or contact Pixalate.Loading the full data…The full data couldn’t be loaded. Reload the page to try again, or contact Pixalate.

Samsung Smart TV
28%


Beyond the top 5See the full device rankings — contact Pixalate →

4 more devices in this breakdown are locked.Unlocking is free — it only takes your email address.Unlocking needs JavaScript. Enable it and reload the page, or contact Pixalate.Loading the full data…The full data couldn’t be loaded. Reload the page to try again, or contact Pixalate.

Roku
25%


Beyond the top 5See the full device rankings — contact Pixalate →

4 more devices in this breakdown are locked.Unlocking is free — it only takes your email address.Unlocking needs JavaScript. Enable it and reload the page, or contact Pixalate.Loading the full data…The full data couldn’t be loaded. Reload the page to try again, or contact Pixalate.

Aiwa
27%


Beyond the top 5See the full device rankings — contact Pixalate →

4 more devices in this breakdown are locked.Unlocking is free — it only takes your email address.Unlocking needs JavaScript. Enable it and reload the page, or contact Pixalate.Loading the full data…The full data couldn’t be loaded. Reload the page to try again, or contact Pixalate.

Notes: Share of voice is the share of sold open programmatic CTV ads delivered to each device, September 2026, within the selected market. Where two devices show the same rounded value, they are ranked on unrounded share.
Most recent update: October 2026  ·  Source: Pixalate open programmatic CTV traffic
Know which device an ad actually ran on, bundle ID by bundle ID. See CTV Bundle ID Mapping →
Time Series Trends
0%10%20%30%40%Jun 2026Jul 2026Aug 2026Sep 2026Roku, Jun 2026: 33%33%Roku, Jul 2026: 35%35%Roku, Aug 2026: 38%38%Roku, Sep 2026: 29%29%
Roku                        Full historical rankings and trends — contact Pixalate →

2 more devices in this breakdown are locked.Unlocking is free — it only takes your email address.Unlocking needs JavaScript. Enable it and reload the page, or contact Pixalate.Loading the full data…The full data couldn’t be loaded. Reload the page to try again, or contact Pixalate.

0%10%20%30%40%Jun 2026Jul 2026Aug 2026Sep 2026Roku, Jun 2026: 34%34%Roku, Jul 2026: 36%36%Roku, Aug 2026: 39%39%Roku, Sep 2026: 30%30%
Roku                        Full historical rankings and trends — contact Pixalate →

2 more devices in this breakdown are locked.Unlocking is free — it only takes your email address.Unlocking needs JavaScript. Enable it and reload the page, or contact Pixalate.Loading the full data…The full data couldn’t be loaded. Reload the page to try again, or contact Pixalate.

0%10%20%30%Jun 2026Jul 2026Aug 2026Sep 2026Samsung Smart TV, Jun 2026: 18%18%Samsung Smart TV, Jul 2026: 25%25%Samsung Smart TV, Aug 2026: 18%18%Samsung Smart TV, Sep 2026: 19%19%
Samsung Smart TV                        Full historical rankings and trends — contact Pixalate →

2 more devices in this breakdown are locked.Unlocking is free — it only takes your email address.Unlocking needs JavaScript. Enable it and reload the page, or contact Pixalate.Loading the full data…The full data couldn’t be loaded. Reload the page to try again, or contact Pixalate.

0%10%20%30%Jun 2026Jul 2026Aug 2026Sep 2026Jio, Jun 2026: 23%23%Jio, Jul 2026: 27%27%Jio, Aug 2026: 23%23%Jio, Sep 2026: 22%22%
Jio                        Full historical rankings and trends — contact Pixalate →

2 more devices in this breakdown are locked.Unlocking is free — it only takes your email address.Unlocking needs JavaScript. Enable it and reload the page, or contact Pixalate.Loading the full data…The full data couldn’t be loaded. Reload the page to try again, or contact Pixalate.

0%10%20%30%40%Jun 2026Jul 2026Aug 2026Sep 2026Aiwa, Jun 2026: 24%24%Aiwa, Jul 2026: 20%20%Aiwa, Aug 2026: 22%22%Aiwa, Sep 2026: 20%20%
Aiwa                        Full historical rankings and trends — contact Pixalate →

2 more devices in this breakdown are locked.Unlocking is free — it only takes your email address.Unlocking needs JavaScript. Enable it and reload the page, or contact Pixalate.Loading the full data…The full data couldn’t be loaded. Reload the page to try again, or contact Pixalate.

0%10%20%30%40%Jun 2026Jul 2026Aug 2026Sep 2026Roku, Jun 2026: 34%34%Roku, Jul 2026: 36%36%Roku, Aug 2026: 39%39%Roku, Sep 2026: 30%30%
Roku                        Full historical rankings and trends — contact Pixalate →

2 more devices in this breakdown are locked.Unlocking is free — it only takes your email address.Unlocking needs JavaScript. Enable it and reload the page, or contact Pixalate.Loading the full data…The full data couldn’t be loaded. Reload the page to try again, or contact Pixalate.

0%10%20%30%40%Jun 2026Jul 2026Aug 2026Sep 2026Samsung Smart TV, Jun 2026: 23%23%Samsung Smart TV, Jul 2026: 35%35%Samsung Smart TV, Aug 2026: 36%36%Samsung Smart TV, Sep 2026: 28%28%
Samsung Smart TV                        Full historical rankings and trends — contact Pixalate →

2 more devices in this breakdown are locked.Unlocking is free — it only takes your email address.Unlocking needs JavaScript. Enable it and reload the page, or contact Pixalate.Loading the full data…The full data couldn’t be loaded. Reload the page to try again, or contact Pixalate.

0%10%20%30%Jun 2026Jul 2026Aug 2026Sep 2026Roku, Jun 2026: 21%21%Roku, Jul 2026: 21%21%Roku, Aug 2026: 29%29%Roku, Sep 2026: 25%25%
Roku                        Full historical rankings and trends — contact Pixalate →

2 more devices in this breakdown are locked.Unlocking is free — it only takes your email address.Unlocking needs JavaScript. Enable it and reload the page, or contact Pixalate.Loading the full data…The full data couldn’t be loaded. Reload the page to try again, or contact Pixalate.

0%10%20%30%Jun 2026Jul 2026Aug 2026Sep 2026Aiwa, Jun 2026: 24%24%Aiwa, Jul 2026: 13%13%Aiwa, Aug 2026: 20%20%Aiwa, Sep 2026: 27%27%
Aiwa                        Full historical rankings and trends — contact Pixalate →

2 more devices in this breakdown are locked.Unlocking is free — it only takes your email address.Unlocking needs JavaScript. Enable it and reload the page, or contact Pixalate.Loading the full data…The full data couldn’t be loaded. Reload the page to try again, or contact Pixalate.

Notes: Monthly share of voice, Jun 2026 to Sep 2026, for the three devices ranked highest in September 2026 in the selected market.
Most recent update: October 2026  ·  Source: Pixalate open programmatic CTV traffic
Go past the device to the channel and show your ads ran against. Explore the OpenEPG Index →
Observations

Research Notes

These notes summarize measured results for September 2026 across 6.9B open programmatic CTV ad impressions analyzed from Jun 2026 to Sep 2026.

Roku holds the largest global share. Roku received 29% of open programmatic CTV ads worldwide in September 2026. Across the four months measured, its global share ranged from 29% (Sep 2026) to 38% (Aug 2026).

The leading device differs by region. Roku leads North America (30%), Aiwa leads LATAM (20%), Samsung Smart TV leads EMEA (19%), and Jio leads APAC (22%).

The leading device differs by country. Roku leads the United States (30%) and Canada (25%), Samsung Smart TV leads the United Kingdom (28%), and Aiwa leads Mexico (27%).

Leader share varies widely between markets. Across the regions and countries measured, the top device’s share of voice ranges from 19% in EMEA to 30% in the United States.

Research notes describe measured results for the period studied. They are not predictions and do not attribute cause.

Methodology

How This Analysis Was Performed

Pixalate’s data science team analyzed 6.9B open programmatic ad impressions on Connected TV (CTV) devices worldwide, from Jun 2026 to Sep 2026.

Share of voice (SOV). A device’s share of voice is its proportion of the sold open programmatic CTV ads Pixalate measured. For example, if Device X received 20 of 100 ads in one month, its SOV was 20%. If it then received 36 of 120 ads the next month, its SOV rose to 30%, a 50% increase in market share.

Device identification. Devices with no identified manufacturer are excluded before share of voice is calculated.

Region of traffic. Pixalate determines the country and region of traffic from the detected IP address and other identifiers.

Data sources. Pixalate’s datasets, used exclusively to derive these insights, consist predominantly of buy-side open auction programmatic traffic.

FAQ

Frequently Asked Questions

What does share of voice (SOV) measure?

The share of sold open programmatic CTV ads delivered to a given device during the month, as measured by Pixalate. If a device received 20 of 100 ads, its share of voice is 20%.

Is share of voice the same as device sales or households?

No. It reflects where open programmatic CTV ads were delivered, not how many devices were sold or how many homes own them.

Why don't the rankings list the same devices?

Each region and country is ranked independently on its own traffic, so the five highest-share devices differ from market to market.

See what's behind the device

Device share tells you where CTV ads land. Pixalate's CTV Bundle ID Mapping verifies which app an ad ran in across every device platform, and the OpenEPG Index shows the channel and show behind it.

About Pixalate

Pixalate is a global platform specializing in privacy compliance, ad fraud prevention, and digital ad supply chain data intelligence. Founded in 2012 and recognized by UNICEF as a “key innovator” for children’s online privacy, Pixalate is trusted by regulators, data researchers, advertisers, publishers, ad tech platforms, and financial analysts across the Connected TV (CTV), mobile app, and website ecosystems. Pixalate is accredited by the MRC for the detection and filtration of Sophisticated Invalid Traffic (SIVT).

All figures reflect open programmatic CTV advertising share of voice as measured by Pixalate. Rankings are for September 2026; the time series covers Jun 2026 to Sep 2026. Percentages are rounded to whole numbers.

Disclaimer

The content of this report reflects Pixalate’s opinions with respect to the factors that Pixalate believes can be useful to the digital media industry. Any data shared is grounded in Pixalate’s proprietary technology and analytics, which Pixalate is continuously evaluating and updating. Any references to outside sources should not be construed as endorsements. Pixalate’s opinions are just that, opinions, which means that they are neither facts nor guarantees.

Pixalate is sharing this data not to impugn the standing or reputation of any entity, person, or app, but, instead, to report findings and trends pertaining to the time period studied.

This report–including all content set forth herein–constitutes Pixalate “Materials” under Pixalate’s Terms of Use, and is licensed subject to–and conditioned expressly upon–compliance with each of the applicable terms and conditions of such Pixalate Terms of Use.

The following disclaimer applies to all materials produced by Pixalate, including this report, where third party logos or trademarks are specifically mentioned, displayed, or used as a point of reference or research concerning any insights derived by Pixalate: Roku logo(s) are trademarks of Roku, Inc., the Amazon Fire TV logo(s) are trademarks of Amazon.com, Inc., the Samsung logo(s) and Samsung Smart TV logo(s) are trademarks of Samsung Electronics Co., Ltd., the Apple TV logo(s) are trademarks of Apple Inc., the LG logo(s) are trademarks of LG Electronics, Inc., the Hisense logo(s) are trademarks of Hisense Co., Ltd., the TCL logo(s) are trademarks of TCL Technology Group Corporation, the Xiaomi logo(s) are trademarks of Xiaomi Inc., the Jio logo(s) are trademarks of Reliance Jio Infocomm Limited, the Sony logo(s) are trademarks of Sony Group Corporation, the Chromecast logo(s) are trademarks of Google LLC, the Horizon logo(s) are trademarks of Liberty Global, the TELUS logo(s) are trademarks of TELUS Corporation, and the Aiwa and Astron logo(s) are trademarks of their respective owners. These companies are not affiliated with, nor do they endorse or sponsor, any products, data, content, reports, materials, or services associated with Pixalate. Any other brand logos, names, or trademarks not explicitly mentioned herein – but otherwise mentioned, displayed, or used in any of Pixalate’s materials, including this report – are the property of their respective owners.

Schedule a Demo

Interested in learning more about Pixalate’s ad fraud prevention solutions? Let’s connect. Share your challenges, and our team will be in touch shortly. Thank you for reaching out.